

Answered step by step
Verified Expert Solution
Question
1 Approved Answer
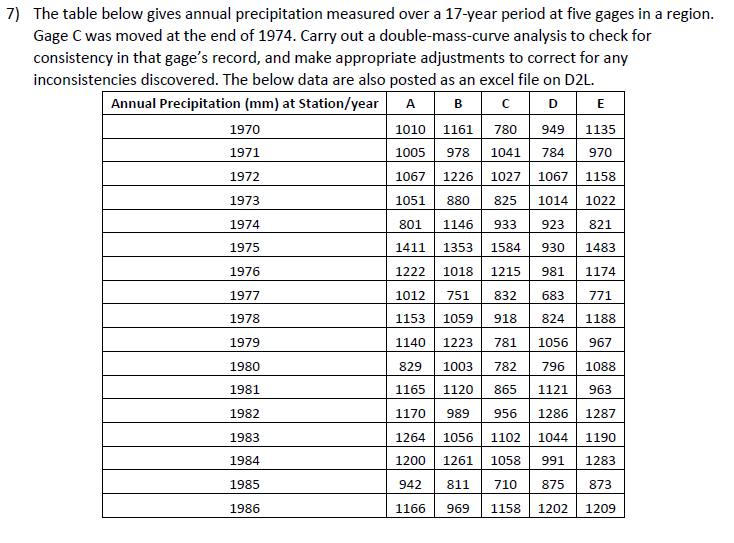
7) The table below gives annual precipitation measured over a 17-year period at five gages in a region Gage C was moved at the end
Step by Step Solution
There are 3 Steps involved in it
Step: 1

Get Instant Access to Expert-Tailored Solutions
See step-by-step solutions with expert insights and AI powered tools for academic success
Step: 2

Step: 3
Ace Your Homework with AI
Get the answers you need in no time with our AI-driven, step-by-step assistance
Get Started
Audit Effectiveness Meeting The IT Challenge
Authors: Kamil Omoteso
1st Edition
1409434680, 978-1409434689