Answered step by step
Verified Expert Solution
Link Copied!

Question

1 Approved Answer

7. The table below shows the likelihood of a person crashing their car while driving under the influence based on their blood alcohol level (BAC).
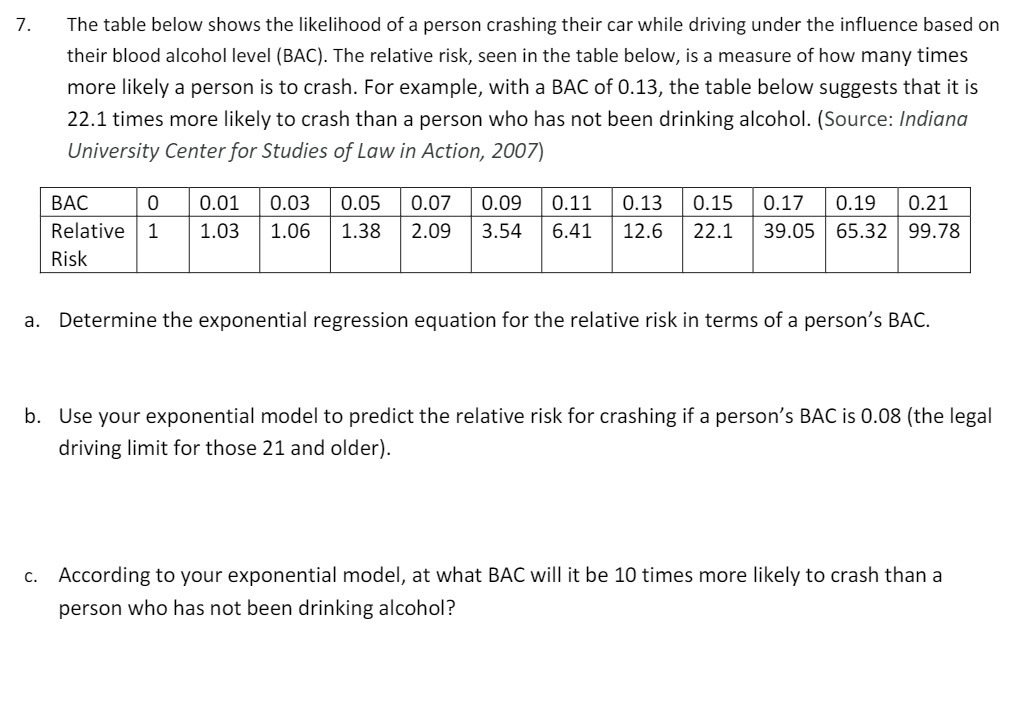
image text in transcribed
7. The table below shows the likelihood of a person crashing their car while driving under the influence based on their blood alcohol level (BAC). The relative risk, seen in the table below, is a measure of how many times more likely a person is to crash. For example, with a BAC of 0.13, the table below suggests that it is 22.1 times more likelvr to crash than a person who has not been drinking alcohol. (Source: indianu University Center for Studies of Low in Action, 2007) 0.07 0.09 0.11 2.09 3.54 6.41 Relative 1 Risk 65.32 99.78 a. Determine the exponential regression equation for the relative risk in terms ofa person's BAC. b. Use your exponential model to predict the relative risk for crashing if a person's BAC is 0.08 (the legal driving limit for those 21 and older}. c. According to your exponential model, at what BAC will it be 10 times more likely to crash than a person who has not been drinking alcohol

Step by Step Solution

There are 3 Steps involved in it

Step: 1

blur-text-image

Get Instant Access to Expert-Tailored Solutions

See step-by-step solutions with expert insights and AI powered tools for academic success

Step: 2

blur-text-image

Step: 3

blur-text-image

Ace Your Homework with AI

Get the answers you need in no time with our AI-driven, step-by-step assistance

Get Started

Recommended Textbook for

Introduction to Probability

Authors: Mark Daniel Ward, Ellen Gundlach

1st edition

716771098, 978-1319060893, 1319060897, 978-0716771098

More Books

Students also viewed these Mathematics questions