Answered step by step
Verified Expert Solution
Link Copied!

Question

1 Approved Answer

7. The top ten marks on a math cumulative exam were: 83, 95, 75, 93, 83, 82, 77, 83, 82, 90 The mode of this
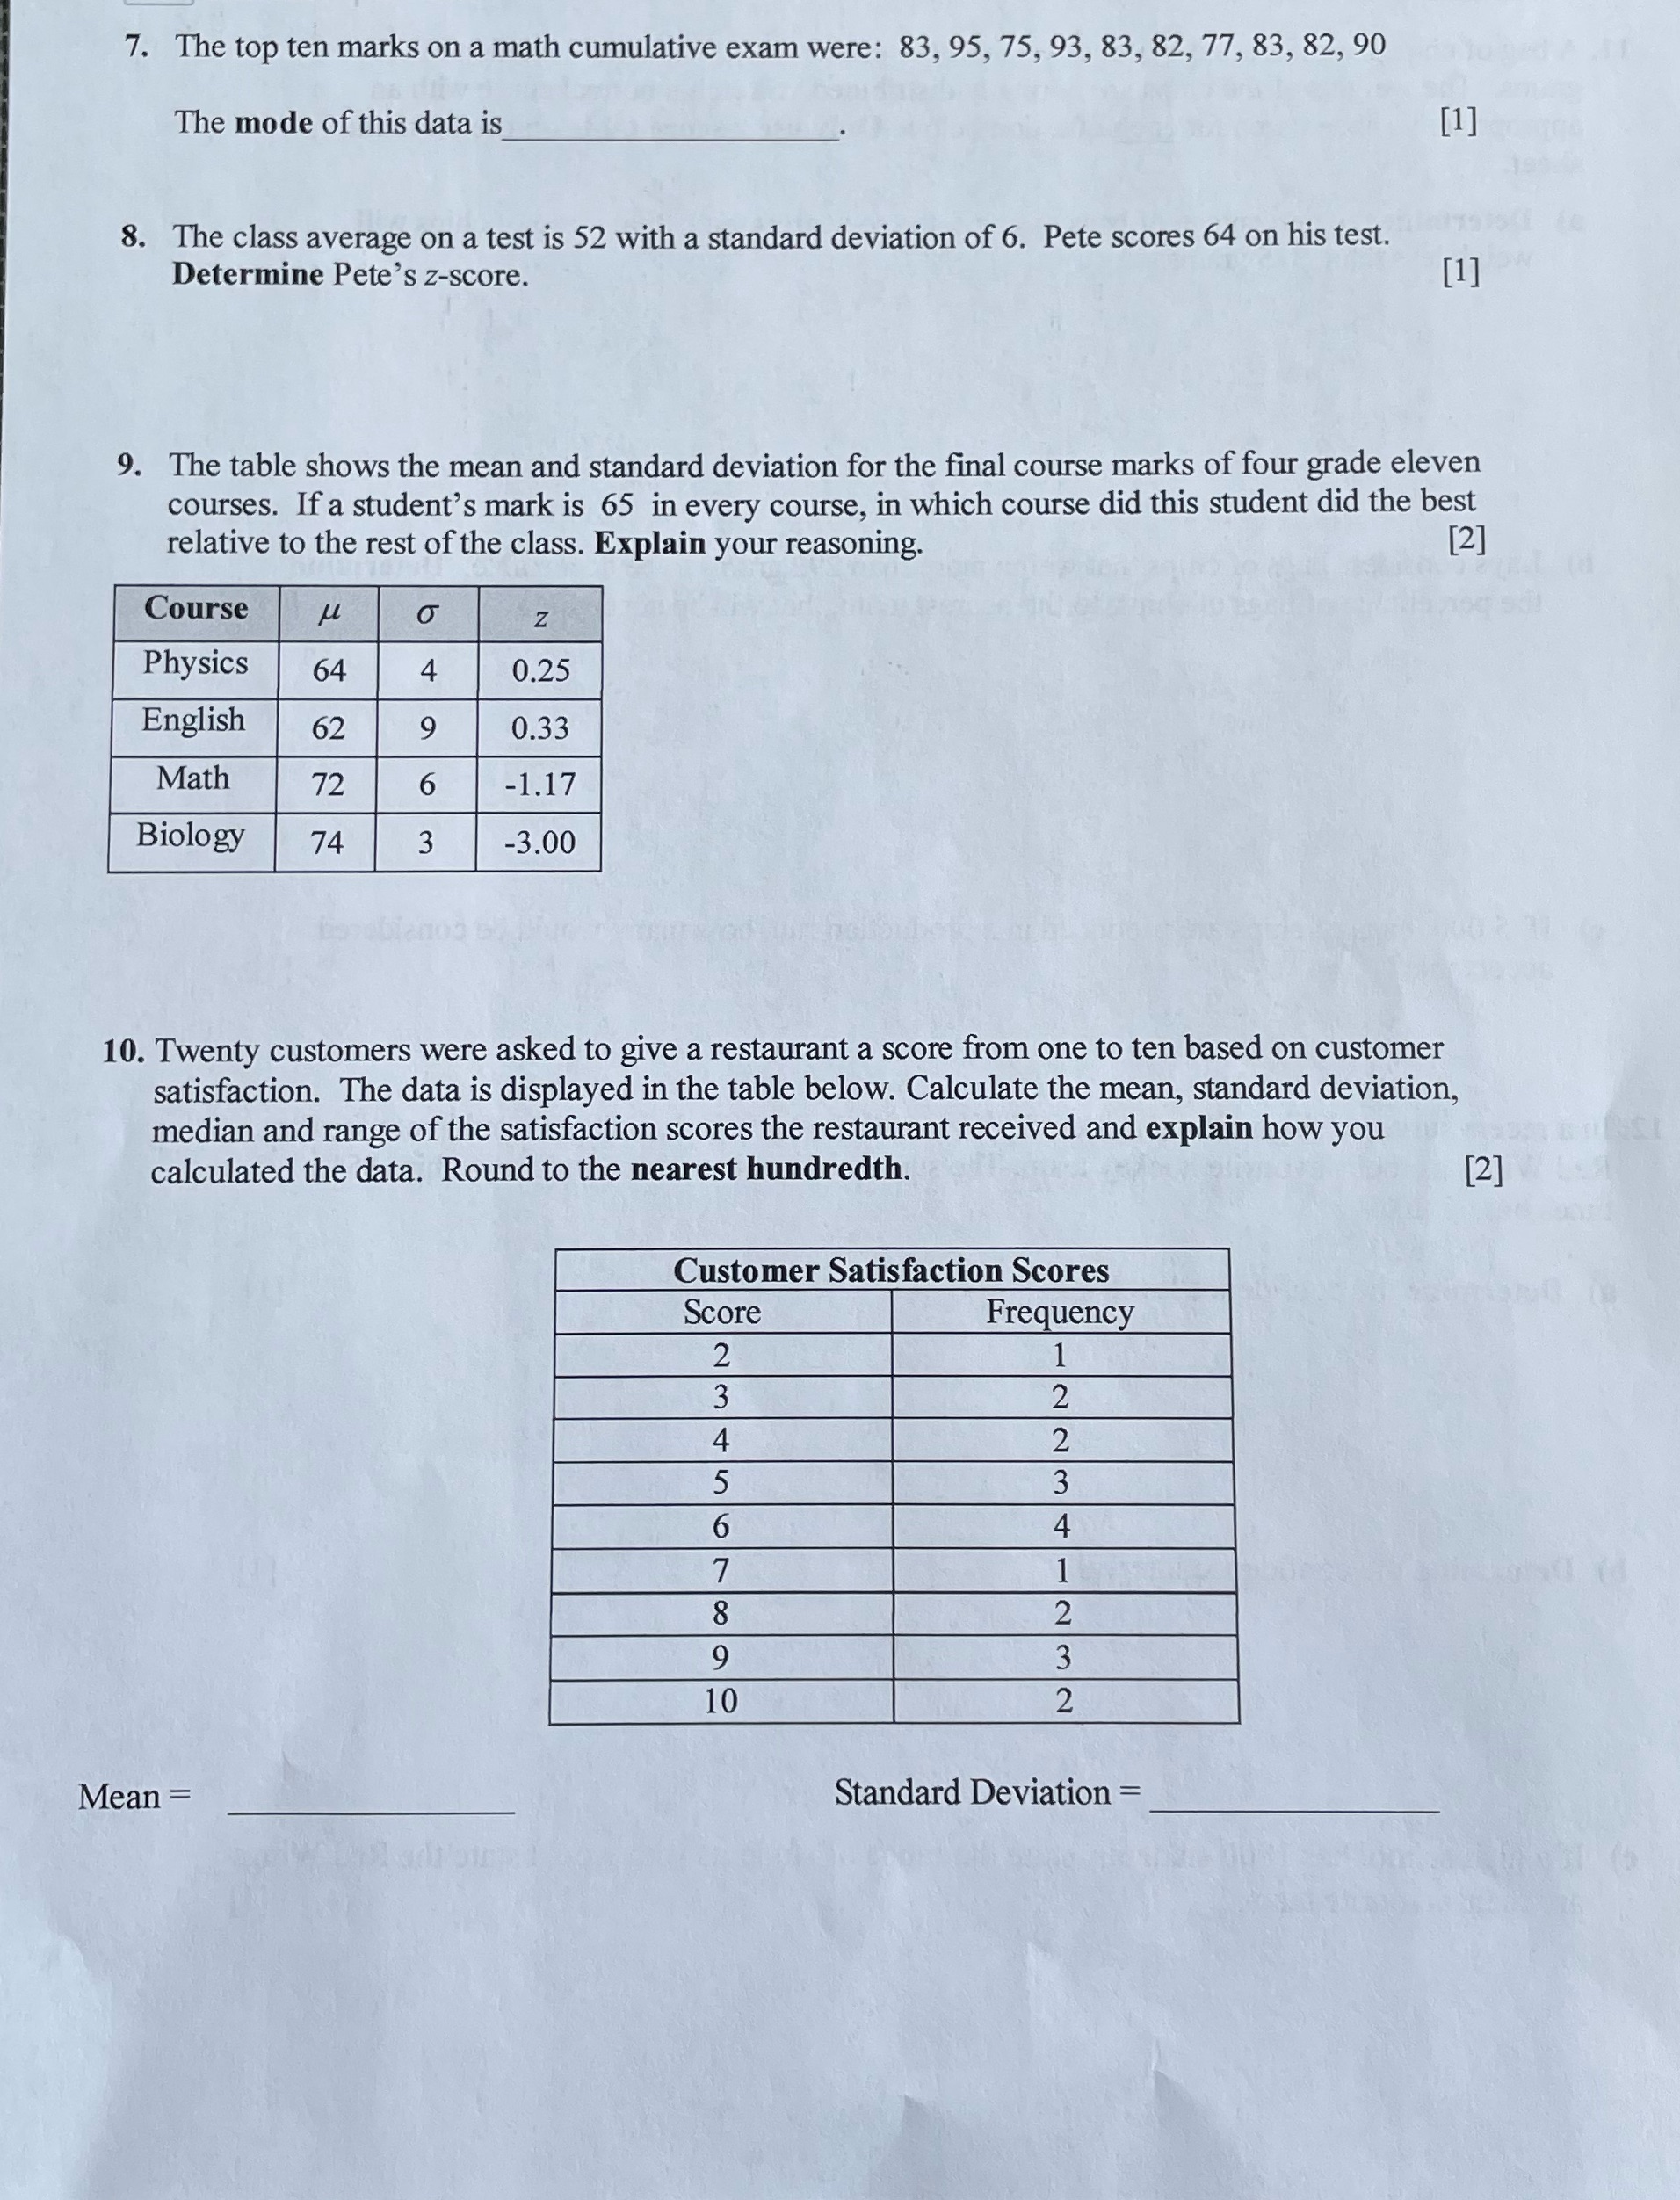
image text in transcribed
7. The top ten marks on a math cumulative exam were: 83, 95, 75, 93, 83, 82, 77, 83, 82, 90 The mode of this data is . [ll 8. The class average on a test is 52 with a standard deviation of 6. Pete scores 64 on his test. Determine Pete's zscore. [ll 9. The table shows the mean and standard deviation for the nal course marks of four grade eleven courses. If a student's mark is 65 in every course, in which course did this student did the best relative to the rest of the class. Explain your reasoning. [2] ---n 10. Twenty customers were asked to give a restaurant a score from one to ten based on customer satisfaction. The data is displayed in the table below. Calculate the mean, standard deviation, median and range of the satisfaction scores the restaurant received and explain how you calculated the data. Round to the nearest hundredth. [2] Customer Satisfaction Scores Frequency |,_a| Mean = Stande Deviation =

Step by Step Solution

There are 3 Steps involved in it

Step: 1

blur-text-image

Get Instant Access to Expert-Tailored Solutions

See step-by-step solutions with expert insights and AI powered tools for academic success

Step: 2

blur-text-image_2

Step: 3

blur-text-image_3

Ace Your Homework with AI

Get the answers you need in no time with our AI-driven, step-by-step assistance

Get Started

Recommended Textbook for

Schaums Easy Outline College Algebra

Authors: Murray Spiegel ,Robert Moyer

1st Edition

0070527091, 978-0070527096

More Books

Students also viewed these Mathematics questions