

Answered step by step
Verified Expert Solution
Question
1 Approved Answer
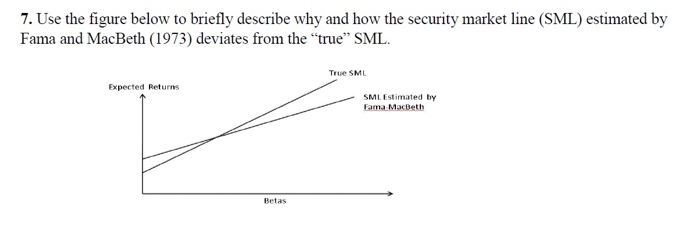
7. Use the figure below to briefly describe why and how the security market line (SML) estimated by Fama and MacBeth (1973) deviates from the
Step by Step Solution
There are 3 Steps involved in it
Step: 1

Get Instant Access to Expert-Tailored Solutions
See step-by-step solutions with expert insights and AI powered tools for academic success
Step: 2

Step: 3
Ace Your Homework with AI
Get the answers you need in no time with our AI-driven, step-by-step assistance
Get Started
Originate Motivate Innovate 7 Steps For Building A Billion Dollar Network
Authors: Shelly Omilade Bell, Sonya Renee Taylor
1st Edition
1119900549, 978-1119900542