

Answered step by step
Verified Expert Solution
Question
1 Approved Answer
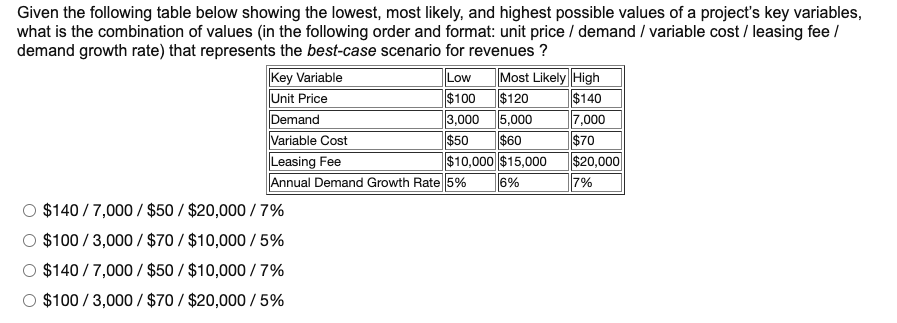
$70 Given the following table below showing the lowest, most likely, and highest possible values of a project's key variables, what is the combination of
Step by Step Solution
There are 3 Steps involved in it
Step: 1

Get Instant Access to Expert-Tailored Solutions
See step-by-step solutions with expert insights and AI powered tools for academic success
Step: 2

Step: 3
Ace Your Homework with AI
Get the answers you need in no time with our AI-driven, step-by-step assistance
Get Started
Profit With Options Essential Methods For Investing Success
Authors: Lawrence G. McMillan
1st Edition
0471225312, 9780471225317