

Answered step by step
Verified Expert Solution
Question
1 Approved Answer
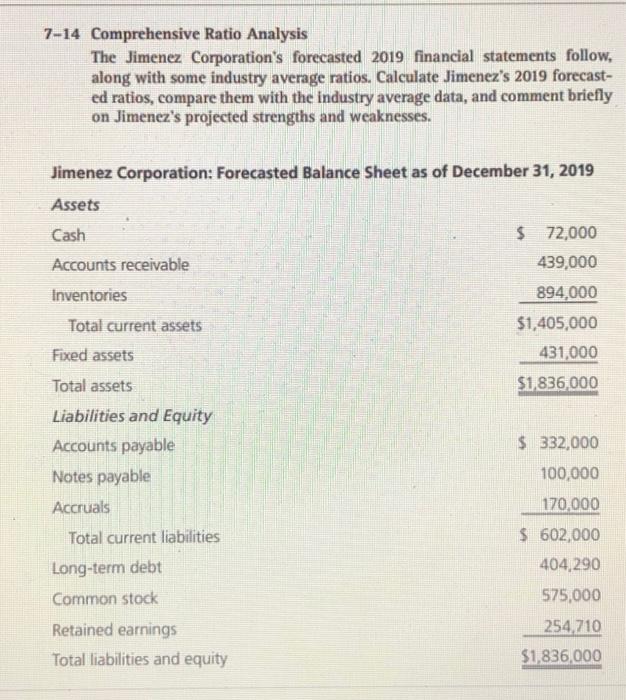
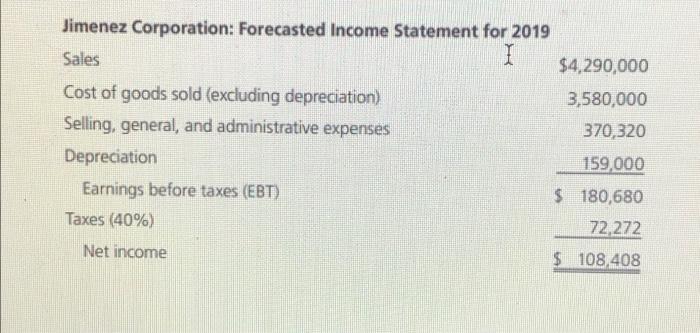
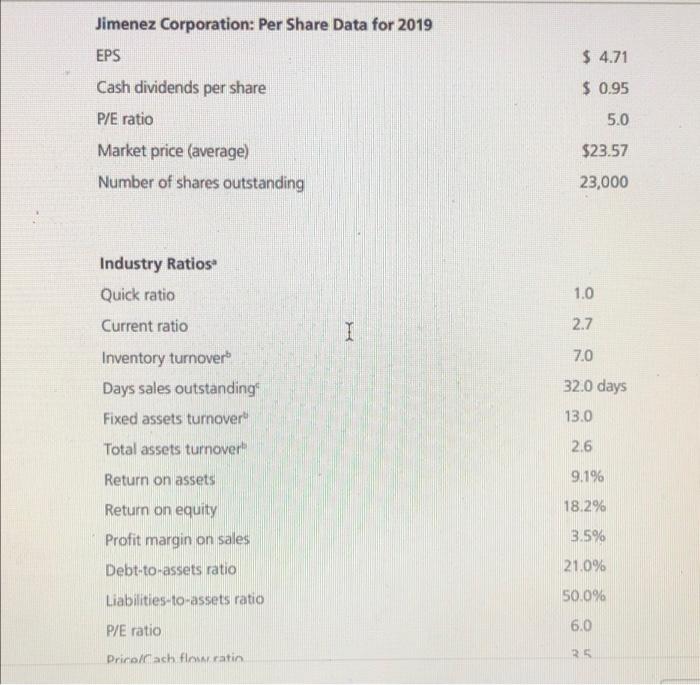
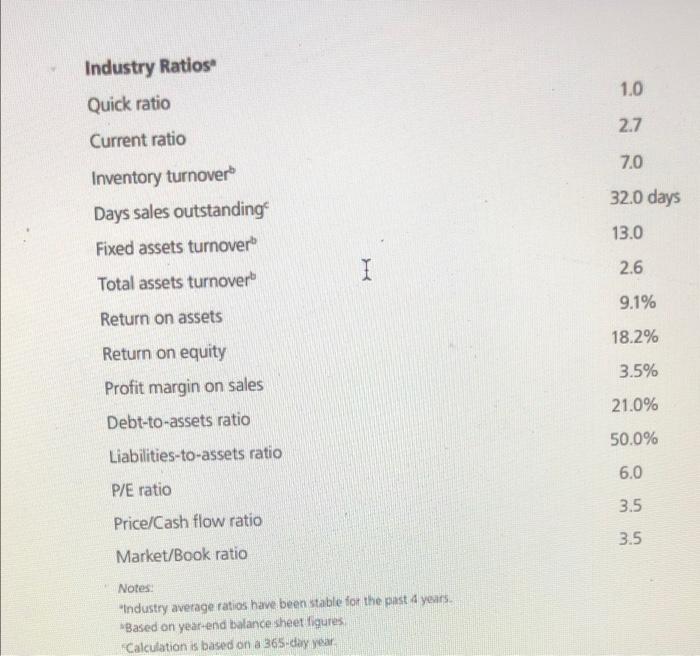
7-14 Comprehensive Ratio Analysis The Jimenez Corporation's forecasted 2019 financial statements follow, along with some industry average ratios. Calculate Jimenez's 2019 forecast- ed ratios, compare
Step by Step Solution
There are 3 Steps involved in it
Step: 1

Get Instant Access to Expert-Tailored Solutions
See step-by-step solutions with expert insights and AI powered tools for academic success
Step: 2

Step: 3
Ace Your Homework with AI
Get the answers you need in no time with our AI-driven, step-by-step assistance
Get Started
Roadmap To The Markets
Authors: Tom Busby
1st Edition
0934380856, 978-0934380850