

Answered step by step
Verified Expert Solution
Question
1 Approved Answer
7-2 please, thankyou Investments - Analysis and Management -ed 13-Jones Jensen - 2016 (1).pdf - Adobe Acrobat Reader DC (32-bit) File Edit View Sign Window
7-2 please, thankyou
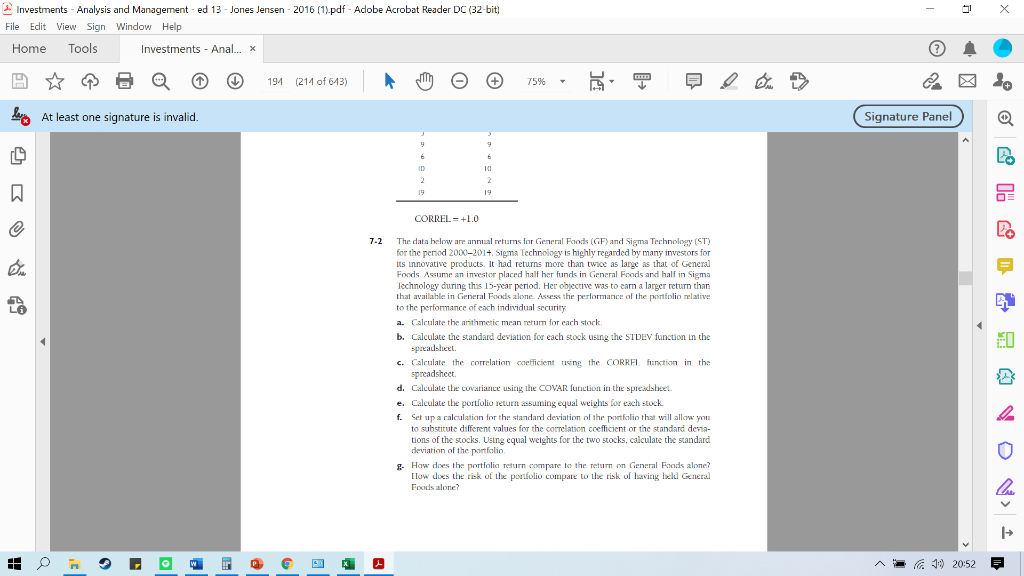
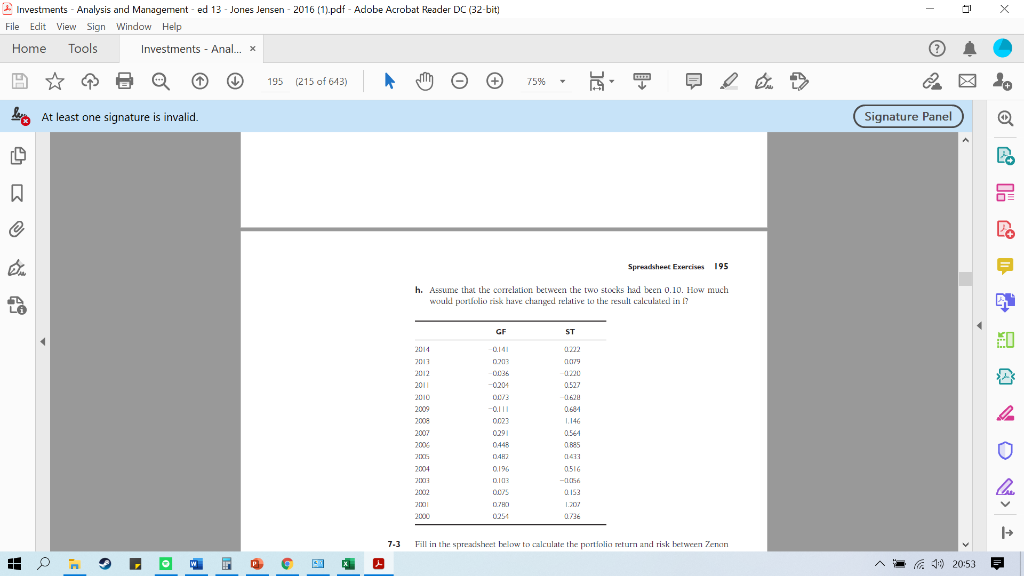
Investments - Analysis and Management -ed 13-Jones Jensen - 2016 (1).pdf - Adobe Acrobat Reader DC (32-bit) File Edit View Sign Window Help Home Tools Investments - Anal... X 194 (214 of 643) 75% hering At least one signature is invalid. Signature Panel 9 6 12 10 2 2 CORREL=+1.0 7-2 LA 0 The data below are annual returns for General Foods (GF) and Sigma Technology (ST) for the period 2000-2014. Sigma Technology is highly regarded by many investors for its innovative products. It had returns more than twice as large as that of General Foods. Assume an investor placed half her funds in General Foods and half in Sigma Technology during this 15-year period. Her objective was to cam a larger return than that available in General Foods alone. Assess the performance of the portfolio relative to the performance of each individual security a. Calculate the arithmetic mean return for each stock b. Calculate the standard deviation for each stock using the STDEV function in the spreadsheet C. Calculate the correlation coefficient using the CORREL function in the spreadsheet d. Calculate the covariance using the COVAR function in the spreadsheet e. Calculate the portfolio retumssuming equal weights for each stock f. Set up a calculation for the standard deviation of the portfolio that will allow you to substitute different values for the correlation coefficient or the standard devia- tions of of the stocks. Using equal weights for the two stocks, calculate the standard deviation of the portfolio - How does the portfolio return compare to the return on General Foods alone? llow does the risk of the portfolio compare to the risk of leaving held General Foods alone? w P x 19 20:52 = Investments - Analysis and Management -ed 13-Jones Jensen - 2016 (1).pdf - Adobe Acrobat Reader DC (32-bit) File Edit View Sign Window Help Home Tools Investments - Anal... X 195 (215 of 643) 75% hering At least one signature is invalid. Signature Panel 12 Spreadsheet Exercises 195 h. Assume that the correlation between the two stocks had been 0.10. How much would portfolio risk have changed relative to the result calculated in ? LA GF ST 0 0.527 2012 2012 2011 2010 2009 2008 2007 2000 2013 2004 0.141 0:20 0036 -0204 0073 -0.111 0023 0291 0448 04H) 0.196 0.684 1.146 0.564 0.885 11433 0516 -Ith) 0.153 L.202 0.736 2002 007 0.70 2001 7-3 Fill in the spreadsheet below to calculate the portfolia return and risk between Zenon w x 19 20:53 = Investments - Analysis and Management -ed 13-Jones Jensen - 2016 (1).pdf - Adobe Acrobat Reader DC (32-bit) File Edit View Sign Window Help Home Tools Investments - Anal... X 194 (214 of 643) 75% hering At least one signature is invalid. Signature Panel 9 6 12 10 2 2 CORREL=+1.0 7-2 LA 0 The data below are annual returns for General Foods (GF) and Sigma Technology (ST) for the period 2000-2014. Sigma Technology is highly regarded by many investors for its innovative products. It had returns more than twice as large as that of General Foods. Assume an investor placed half her funds in General Foods and half in Sigma Technology during this 15-year period. Her objective was to cam a larger return than that available in General Foods alone. Assess the performance of the portfolio relative to the performance of each individual security a. Calculate the arithmetic mean return for each stock b. Calculate the standard deviation for each stock using the STDEV function in the spreadsheet C. Calculate the correlation coefficient using the CORREL function in the spreadsheet d. Calculate the covariance using the COVAR function in the spreadsheet e. Calculate the portfolio retumssuming equal weights for each stock f. Set up a calculation for the standard deviation of the portfolio that will allow you to substitute different values for the correlation coefficient or the standard devia- tions of of the stocks. Using equal weights for the two stocks, calculate the standard deviation of the portfolio - How does the portfolio return compare to the return on General Foods alone? llow does the risk of the portfolio compare to the risk of leaving held General Foods alone? w P x 19 20:52 = Investments - Analysis and Management -ed 13-Jones Jensen - 2016 (1).pdf - Adobe Acrobat Reader DC (32-bit) File Edit View Sign Window Help Home Tools Investments - Anal... X 195 (215 of 643) 75% hering At least one signature is invalid. Signature Panel 12 Spreadsheet Exercises 195 h. Assume that the correlation between the two stocks had been 0.10. How much would portfolio risk have changed relative to the result calculated in ? LA GF ST 0 0.527 2012 2012 2011 2010 2009 2008 2007 2000 2013 2004 0.141 0:20 0036 -0204 0073 -0.111 0023 0291 0448 04H) 0.196 0.684 1.146 0.564 0.885 11433 0516 -Ith) 0.153 L.202 0.736 2002 007 0.70 2001 7-3 Fill in the spreadsheet below to calculate the portfolia return and risk between Zenon w x 19 20:53 =Step by Step Solution
There are 3 Steps involved in it
Step: 1

Get Instant Access to Expert-Tailored Solutions
See step-by-step solutions with expert insights and AI powered tools for academic success
Step: 2

Step: 3
Ace Your Homework with AI
Get the answers you need in no time with our AI-driven, step-by-step assistance
Get Started
Public Finance
Authors: Harvey S. Rosen
5th Edition
025617329X, 978-0256173291