Answered step by step
Verified Expert Solution
Question
1 Approved Answer
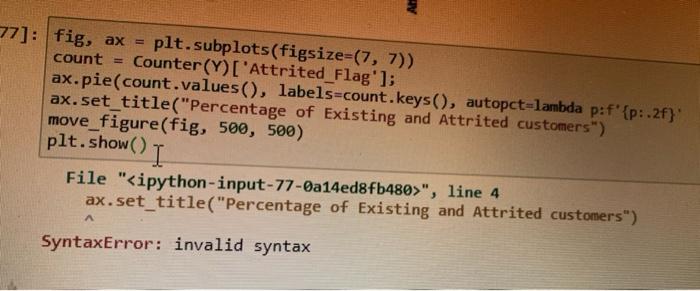
77]: fig, ax = plt.subplots(figsize=(7, 7)) count = Counter(Y)['Attrited_Flag']; ax.pie(count.values(), labels=count.keys(), autopct=lambda p:f'{p:.2f}' ax.set_title(Percentage of Existing and Attrited customers) move_figure(fig, 500, 500) plt.show() I File

Step by Step Solution
There are 3 Steps involved in it
Step: 1

Get Instant Access to Expert-Tailored Solutions
See step-by-step solutions with expert insights and AI powered tools for academic success
Step: 2

Step: 3

Ace Your Homework with AI
Get the answers you need in no time with our AI-driven, step-by-step assistance
Get Started


