

Answered step by step
Verified Expert Solution
Question
1 Approved Answer
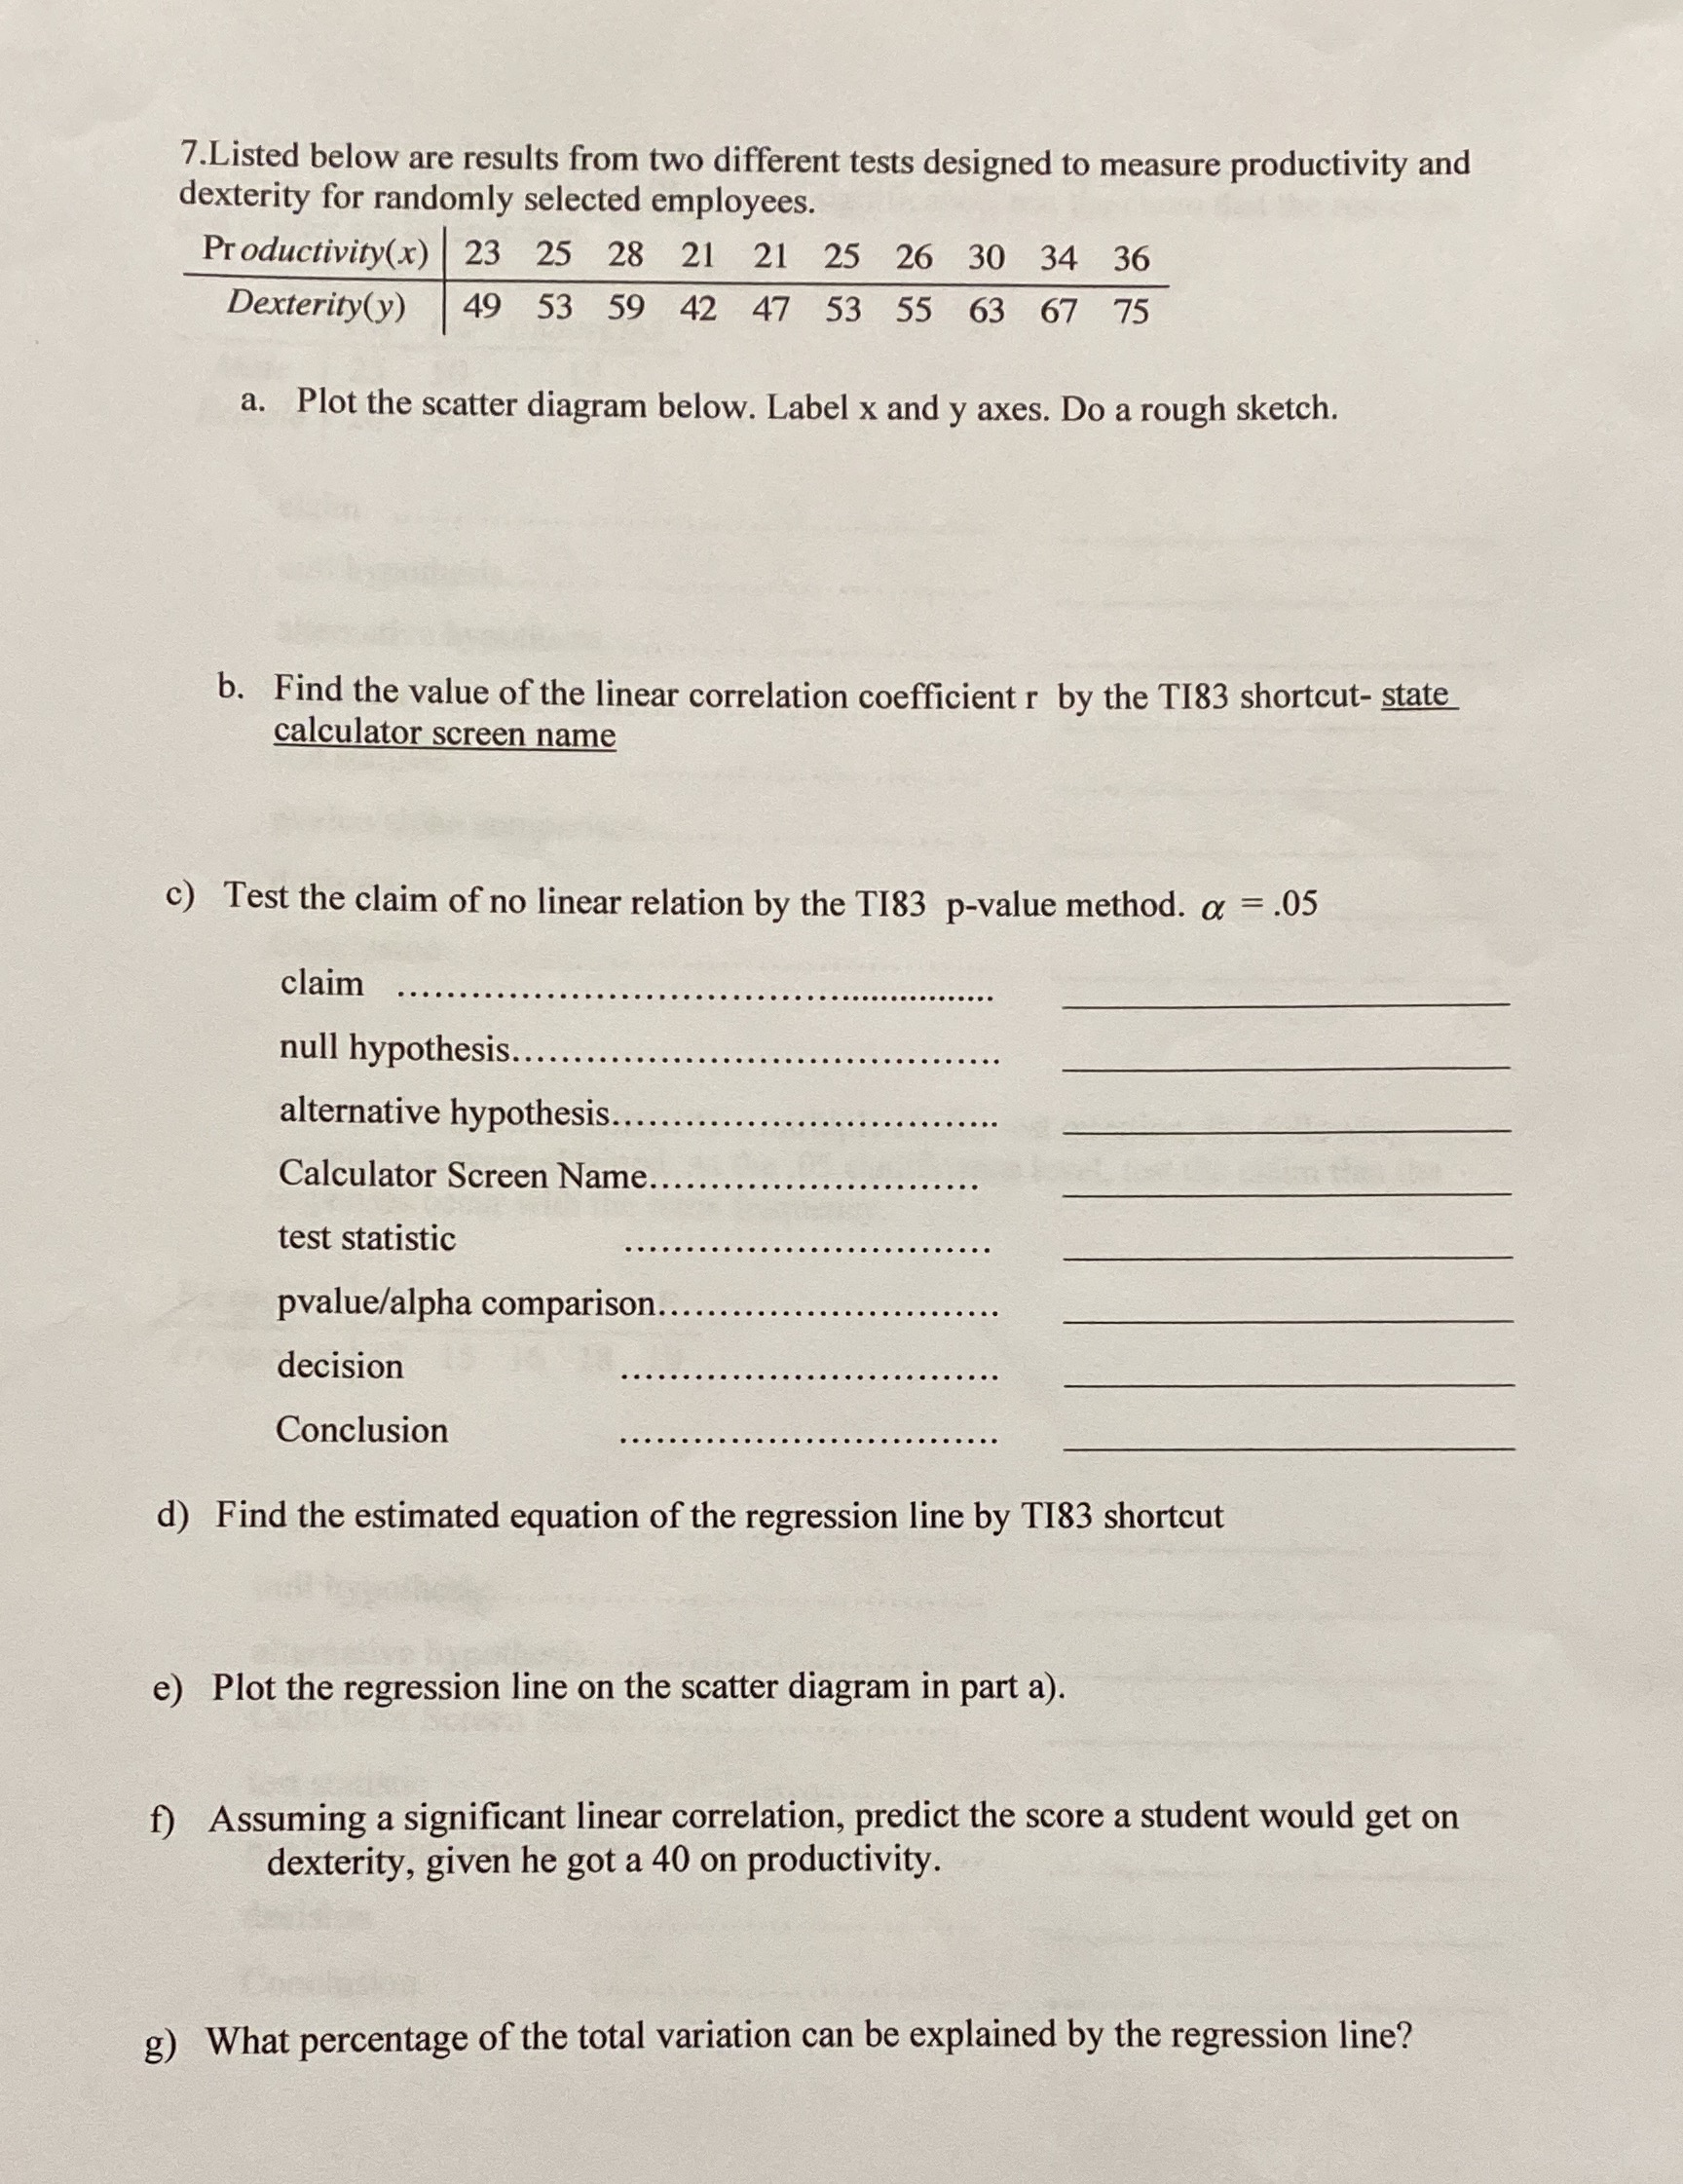
7.Listed below are results from two different tests designed to measure productivity and dexterity for randomly selected employees. Productivity(x) 23 25 28 21 21 25
Step by Step Solution
There are 3 Steps involved in it
Step: 1

Get Instant Access to Expert-Tailored Solutions
See step-by-step solutions with expert insights and AI powered tools for academic success
Step: 2

Step: 3
Ace Your Homework with AI
Get the answers you need in no time with our AI-driven, step-by-step assistance
Get Started
Intermediate Algebra
Authors: Marvin L Bittinger
11th Edition
0321968395, 9780321968395