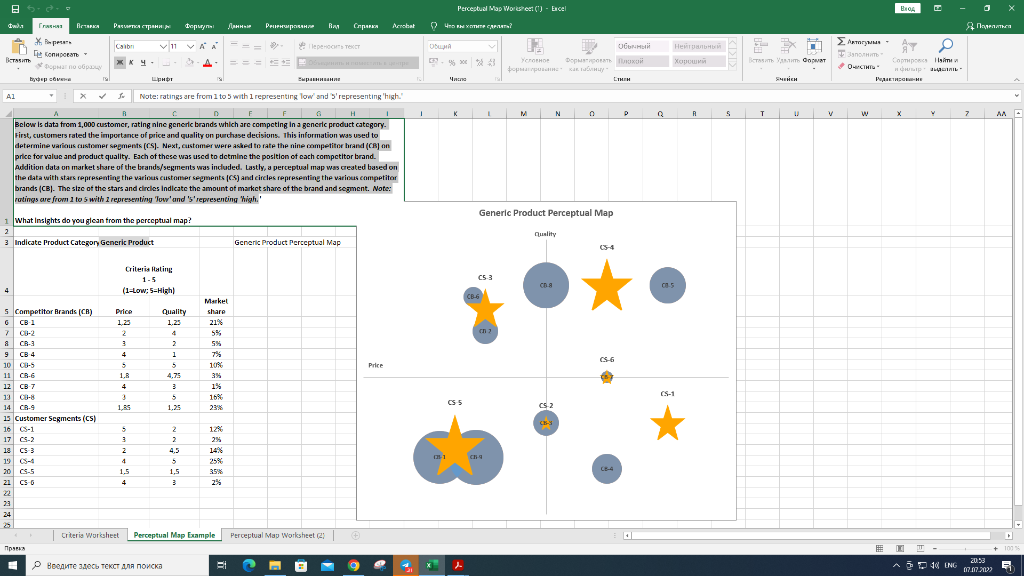
8 " 41 4 5 Competitor Brands (CB) G -1 7 8 9 10 Bera 0-2 CB-3 4 CB-S 11CAG CB-6 12 CB 7 13 CB-8 14CB-1 15 Customer Segments (CS) 16 CS-1 17 CS-2 18 CS 3 19 CS-4 21 23 24 25 20C5-5 21680 . 3 Calibri Note: ratings are from 1 to 5 with 1 representing low' and '3'representing "high" R C D E F F G H Below is data from 1,000 customer, rating nine generic brands which are competing in a generic product category. First, customers rated the importance of price and quality on purchase decisions. This information was used to determine various customer segments (CS). Next, customer were asked to rate the nine competitor brand (CB) on price for value and product quality. Each of these was used to detmine the position of each competitor brand. Addition data on market share of the brands/segments was included. Lastly, a perceptual map was created based on the data with stars representing the various customer segments (CS) and circles representing the various competitor brands (CB). The size of the stars and circles indicate the amount of market share of the brand and segment. Note: ratings are from 1 to s with 2 representing Tow'and 's' representing high. 1 What Insights do you glean from the perceptual map? 3 Indicate Product Category Generic Product I Criteria Rating 1-5 (1-Low:5=High) Price 1.23 2 3 4 5 1.B 4 1,85 VII 5 3 2 4 1,5 4 Quality 1.25 4 2 1 5 4,75 5 1,25 A A 2 4.5 5 1,5 10% 3% Markel share 21% 5% 5% 1% 16% 23% 12% 2% 14% 25% 3.5% 2% Criteria Worksheet Perceptual Map Example === === Ra Acrobat Generic Product Perceptual Map Perceptual Map Worksheet (2) - B Price I Perceptual Map Worksheet (1) - Excel ? 539-46 x 33 (21-1 K CS5 25-3 CB-6 . 19 Generic Product Perceptual Map N Quality 62 [THEM CE Q CS-1 5 7 Fi T U V w A Y A 10 ENG 0 7 20:53 17.07.20 8 " 41 4 5 Competitor Brands (CB) G -1 7 8 9 10 Bera 0-2 CB-3 4 CB-S 11CAG CB-6 12 CB 7 13 CB-8 14CB-1 15 Customer Segments (CS) 16 CS-1 17 CS-2 18 CS 3 19 CS-4 21 23 24 25 20C5-5 21680 . 3 Calibri Note: ratings are from 1 to 5 with 1 representing low' and '3'representing "high" R C D E F F G H Below is data from 1,000 customer, rating nine generic brands which are competing in a generic product category. First, customers rated the importance of price and quality on purchase decisions. This information was used to determine various customer segments (CS). Next, customer were asked to rate the nine competitor brand (CB) on price for value and product quality. Each of these was used to detmine the position of each competitor brand. Addition data on market share of the brands/segments was included. Lastly, a perceptual map was created based on the data with stars representing the various customer segments (CS) and circles representing the various competitor brands (CB). The size of the stars and circles indicate the amount of market share of the brand and segment. Note: ratings are from 1 to s with 2 representing Tow'and 's' representing high. 1 What Insights do you glean from the perceptual map? 3 Indicate Product Category Generic Product I Criteria Rating 1-5 (1-Low:5=High) Price 1.23 2 3 4 5 1.B 4 1,85 VII 5 3 2 4 1,5 4 Quality 1.25 4 2 1 5 4,75 5 1,25 A A 2 4.5 5 1,5 10% 3% Markel share 21% 5% 5% 1% 16% 23% 12% 2% 14% 25% 3.5% 2% Criteria Worksheet Perceptual Map Example === === Ra Acrobat Generic Product Perceptual Map Perceptual Map Worksheet (2) - B Price I Perceptual Map Worksheet (1) - Excel ? 539-46 x 33 (21-1 K CS5 25-3 CB-6 . 19 Generic Product Perceptual Map N Quality 62 [THEM CE Q CS-1 5 7 Fi T U V w A Y A 10 ENG 0 7 20:53 17.07.20