Answered step by step
Verified Expert Solution
Link Copied!

Question

1 Approved Answer

8. A robot is programmed to inject 12.02 grams of red dye into a gallon of paint. Twenty observations show that the following amounts (in
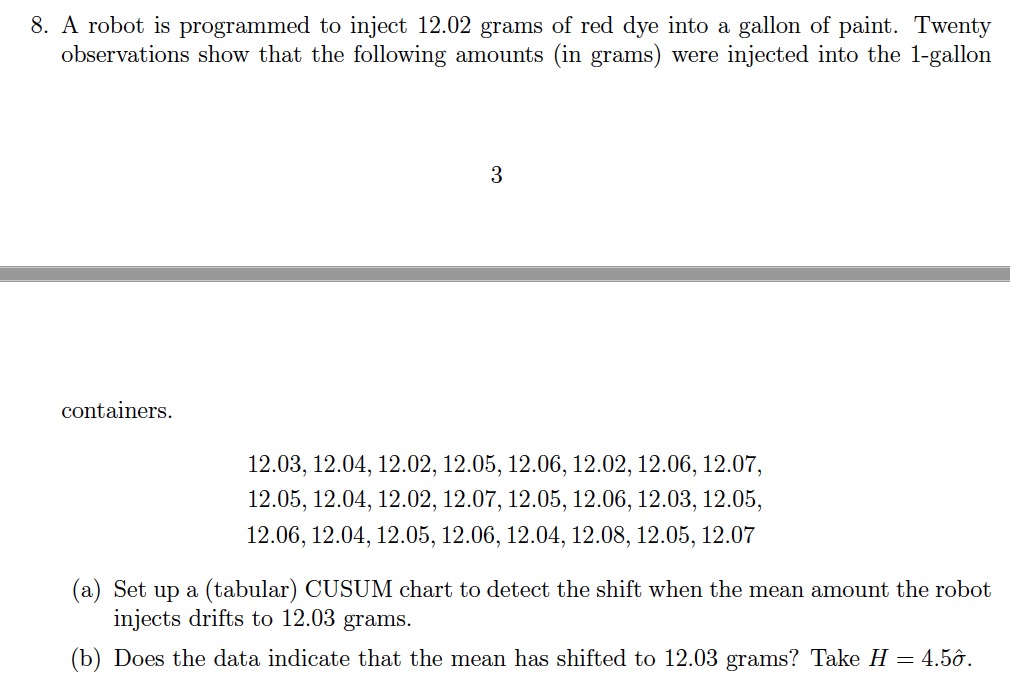
image text in transcribedimage text in transcribedimage text in transcribed
8. A robot is programmed to inject 12.02 grams of red dye into a gallon of paint. Twenty observations show that the following amounts (in grams) were injected into the 1-gallon containers. 12.03, 12.04, 12.02, 12.05, 1206,1202, 12.06, 12.07, 12.05, 12.04, 1202,1207, 1205,1206, 12.03, 12.05, 1206,1204, 1205, 12.06, 12.04, 12.06, 12.05, 12.07 (a) Set up a (tabular) CUSUM chart to detect the shift when the mean amount the robot injects drifts to 12.03 grains. (b) Does the data indicate that the mean has shifted to 12.03 grams? Take H = 4.56. 9. Draw the EWMA control chart for the data presented in the previous problem. Use A : 0.8. Does the EWMA control chart indicate that the robot is out of control? 10. Draw the moving average control chart for the data in Problem 8 using a Window of size 5. Use the data to estimate the necessary population parameters. Assume that the data is normally distributed. We want to restrict the Type I error to be less than 1%. Does the moving average chart indicate that the process is in control?|

Step by Step Solution

There are 3 Steps involved in it

Step: 1

blur-text-image

Get Instant Access to Expert-Tailored Solutions

See step-by-step solutions with expert insights and AI powered tools for academic success

Step: 2

blur-text-image

Step: 3

blur-text-image

Ace Your Homework with AI

Get the answers you need in no time with our AI-driven, step-by-step assistance

Get Started

Recommended Textbook for

An Introduction to the Mathematics of financial Derivatives

Authors: Salih N. Neftci

2nd Edition

978-0125153928, 9780080478647, 125153929, 978-0123846822

More Books

Students also viewed these Mathematics questions