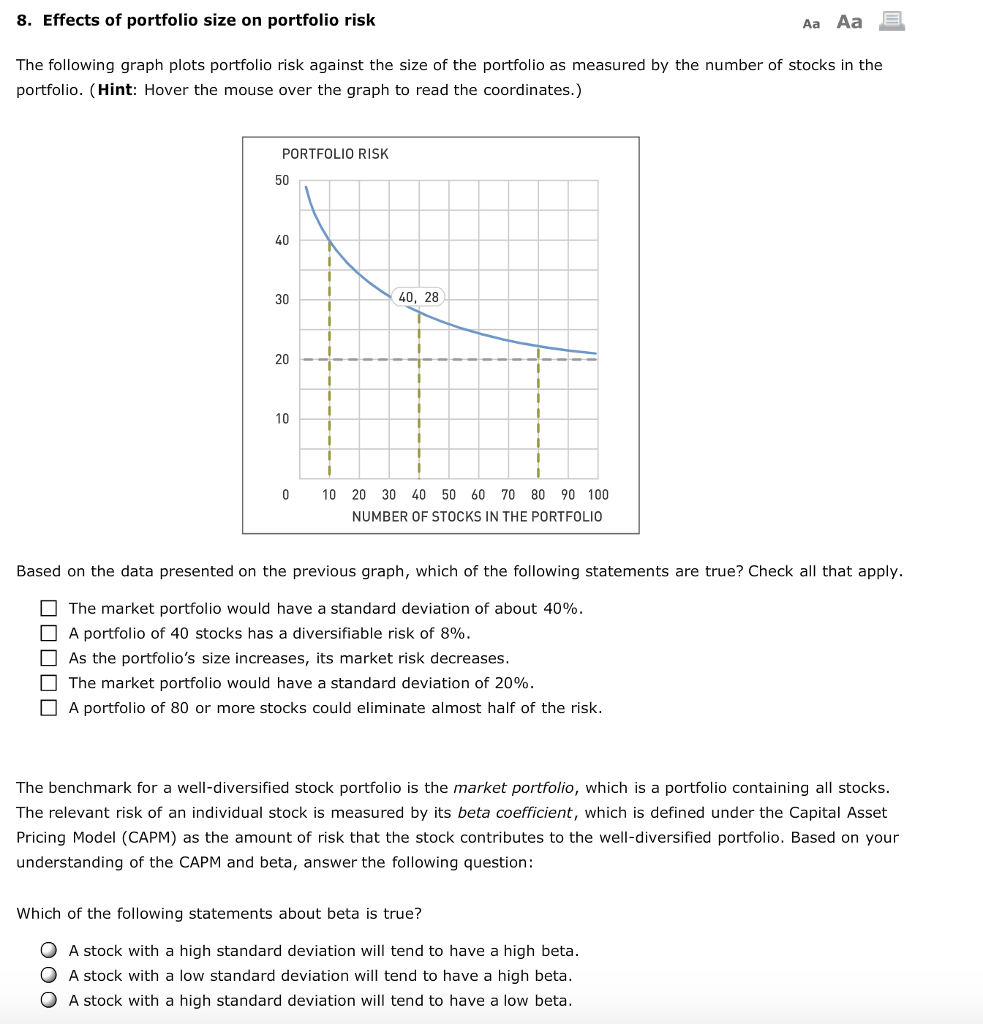
8. Effects of portfolio size on portfolio rislk Aa Aa E The following graph plots portfolio risk against the size of the portfolio as measured by the number of stocks in the portfolio. (Hint: Hover the mouse over the graph to read the coordinates.) PORTFOLIO RISK 50 40 30 40, 28 20 10 10 20 30 40 50 60 70 80 90 100 NUMBER OF STOCKS IN THE PORTFOLIO Based on the data presented on the previous graph, which of the following statements are true? Check all that apply The market portfolio would have a standard deviation of about 40% A portfolio of 40 stocks has a diversifiable risk of 8% As the portfolio's size increases, its market risk decreases [ ] The market portfolio would have a standard deviation of 20% A portfolio of 80 or more stocks could eliminate almost half of the risk The benchmark for a well-diversified stock portfolio is the market portfolio, which is a portfolio containing all stocks. The relevant risk of an individual stock is measured by its beta coefficient, which is defined under the Capital Asset Pricing Model (CAPM) as the amount of risk that the stock contributes to the well-diversified portfolio. Based on your understanding of the CAPM and beta, answer the following question: Which of the following statements about beta is true? A stock with a high standard deviation will tend to have a high beta O A stock with a low standard deviation will tend to have a high beta O A stock with a high standard deviation will tend to have a low beta 8. Effects of portfolio size on portfolio rislk Aa Aa E The following graph plots portfolio risk against the size of the portfolio as measured by the number of stocks in the portfolio. (Hint: Hover the mouse over the graph to read the coordinates.) PORTFOLIO RISK 50 40 30 40, 28 20 10 10 20 30 40 50 60 70 80 90 100 NUMBER OF STOCKS IN THE PORTFOLIO Based on the data presented on the previous graph, which of the following statements are true? Check all that apply The market portfolio would have a standard deviation of about 40% A portfolio of 40 stocks has a diversifiable risk of 8% As the portfolio's size increases, its market risk decreases [ ] The market portfolio would have a standard deviation of 20% A portfolio of 80 or more stocks could eliminate almost half of the risk The benchmark for a well-diversified stock portfolio is the market portfolio, which is a portfolio containing all stocks. The relevant risk of an individual stock is measured by its beta coefficient, which is defined under the Capital Asset Pricing Model (CAPM) as the amount of risk that the stock contributes to the well-diversified portfolio. Based on your understanding of the CAPM and beta, answer the following question: Which of the following statements about beta is true? A stock with a high standard deviation will tend to have a high beta O A stock with a low standard deviation will tend to have a high beta O A stock with a high standard deviation will tend to have a low beta