Answered step by step
Verified Expert Solution
Question
1 Approved Answer
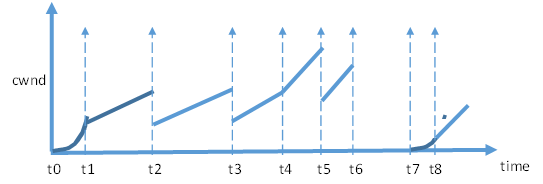
8. In the figure below, identify the following a. slow-start phase b. congestion avoidance phase or AIMD phase c. RTO d. Triple-duplicate drop e. Additive

8. In the figure below, identify the following a. slow-start phase b. congestion avoidance phase or AIMD phase c. RTO d. Triple-duplicate drop e. Additive increase f. Multiplicative decrease g. Time out h. The initial value of the Slow-Start Threshold i. Also, explain what could have happened at t4 j. Explain what happened at t8 as compared to t1
cwnd t0 t1 t2 t3 t4 t5 t6 t7 t8 timeStep by Step Solution
There are 3 Steps involved in it
Step: 1

Get Instant Access to Expert-Tailored Solutions
See step-by-step solutions with expert insights and AI powered tools for academic success
Step: 2

Step: 3

Ace Your Homework with AI
Get the answers you need in no time with our AI-driven, step-by-step assistance
Get Started


