Question
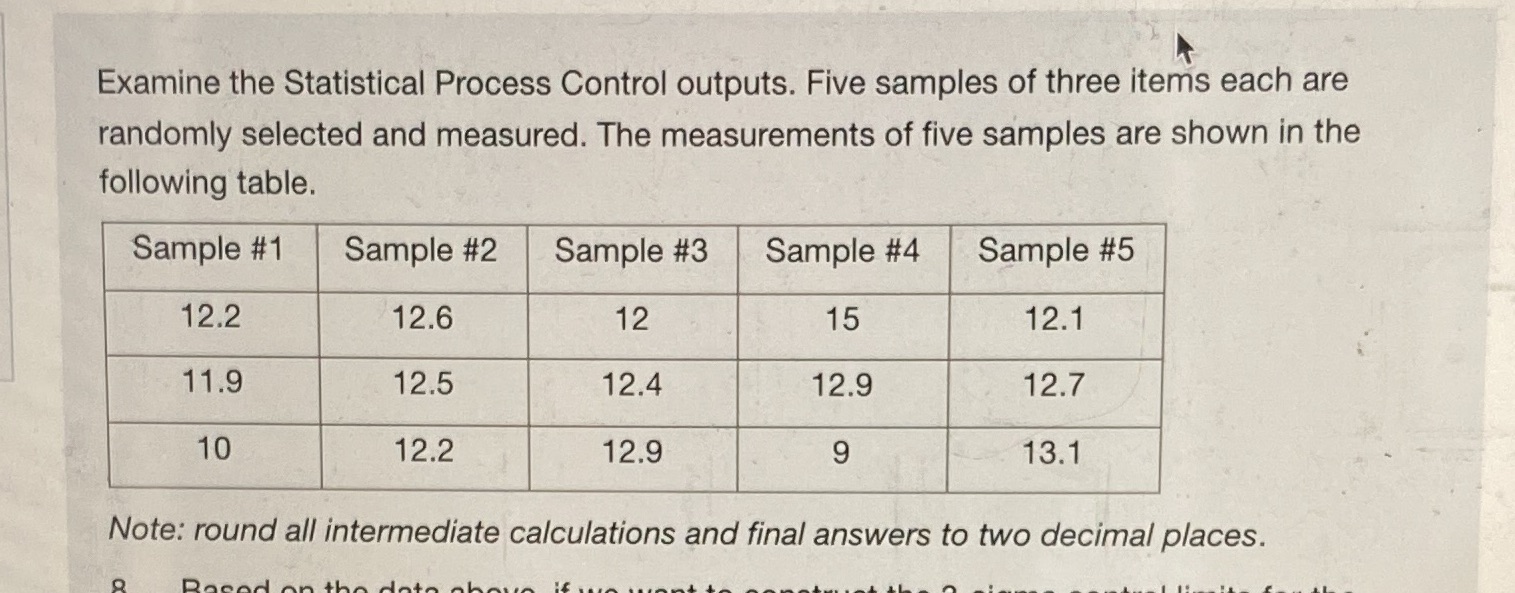
8 Note: round all intermediate calculations and final answers to two decimal places.8.Based on the data above, if we want to construct the 3-sigma control
8 Note: round all intermediate calculations and final answers to two decimal places.8.Based on the data above, if we want to construct the 3-sigma control limits for the mean chart, what are the LCL and UCL?Enter 1 if your answer is:11.89 and 12.96Enter 2 if your answer is:10.09 and 14.37Enter 3 if your answer is:9.48 and 14.98Enter 4 if your answer is:11.01 and 13.45Enter 5 if your answer is:10.75 and 13.85Answer: 9.Based on the data above, if we want to construct the 3-sigma control limits for the range chart, what are the LCL and UCL?Enter 1 if your answer is:0 and 1.69Enter 2 if your answer is:0 and 4.45Enter 3 if your answer is:0 and 5.40Enter 4 if your answer is:0 and 6.94Enter 5 if your answer is:0 and 5.72Answer:=10.Based on the data above and the control limits for the mean chart and the range chart from the previous questions, which of the following statement is correct?Enter 1 if your answer is:The process is in-control in the mean chart, but out-of-control in the range chart.Enter 2 if your answer is:The process is out-of-control in the mean chart, but in-control in the range chart.Enter 3 if your answer is:The process is in-control in both charts.Enter 4 if your answer is:The process is out-of-control in both charts.Enter 5 if your answer is:The process is out-of-control because there are outliers in the measurements.Answer:=

Step by Step Solution
There are 3 Steps involved in it
Step: 1

Get Instant Access to Expert-Tailored Solutions
See step-by-step solutions with expert insights and AI powered tools for academic success
Step: 2

Step: 3

Ace Your Homework with AI
Get the answers you need in no time with our AI-driven, step-by-step assistance
Get Started


