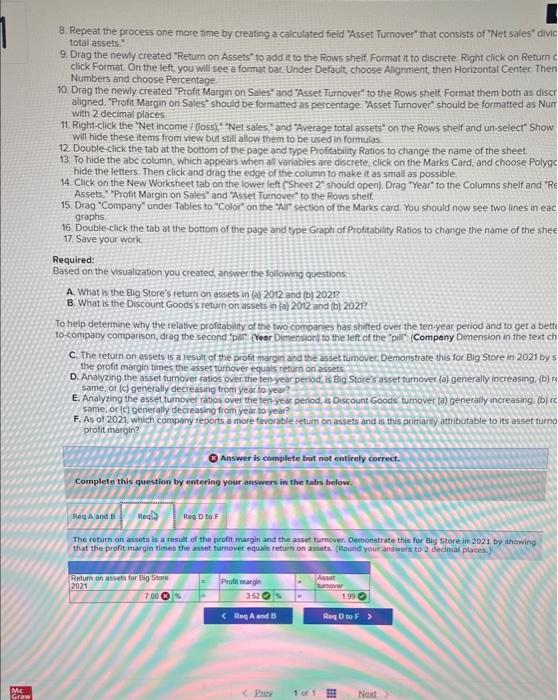
8. Repeat the process one more time by creating a caliculated field "Asset. Turnover" that consists of "Net sales" divic total assets." 9. Drag the newy created "Rewin on Assets" to add it to the Rows shelf. Format it to discrete Right click on Return click Format. On the left, you will see a format bat. Under Default, choose Alignment, then Horizontat Center Then Numbers and choose Percentage 10. Drag the newly created "Profit Margin on Sales" and "Asset Tumover" to the Rows shelf. Format them both as disct aligned. "Profit Margin on Sales" should be formatted as percentage. "Asset Turnover" should be formatted as Num with 2 decimal places 11. Right-click the "Net income? (6os5), " Net sales," and "Average total assets" on the Rows shelf and un-select" Show will hide these ilems from view but still allow them to be used in formulas. 12 Double-click the tab at the bottom of the page and type Profitability Ratios to change the name of the sheet. 13. To hide the abc column, which appears when all variables are discrete, click on the Marks Card, and choose Polygc hide the letters. Then click and drag the edge of the column to make it as small as possible. Assets," "Proft Margin on Sales" and "Asset Turnover" to the Rows shelf. 15. Drag "Company" under Fables to "Color" on the "Ar" section of the Marks card You should now see two lines in eac graphs 16. Double-click the tab at the bottom of the page and type Graph of Protitabilty Ratios to change the name of the shee 17. Save your work Required: Based on the visualization you created, answer the following questipns A. What is the Big Store's return on assets in (a) 2012 and (b) 2021? B. What is the Discount Goods's return on assets in (a) 2012 and (b) 2021 ? To heip detemine why the relative profitabinity of the two companies has shifted over the ten-year period and to get a betti to-company comparison, drag the second "per. (Yeer Dimension) to the left of the "pill (Company Dimension in the text ch C. The teturn on assets is a result of the profit margin and the asset furnovec. Demonstrate this for Big Store in 2021 by. 5 the profit margin times the asset turnover equals return on assets, D. Analyzing the asset turnover ratios over the tenyear period, is Big. Stores asset turnover (a) generally increasing. (b) a same, of (c) generally decreasing from year to year? E. Analyzing the asset turnover ratios over the tenyear penod, is Discount Goods turnover (a) generally increasing, (b) ic same, or (c) generally decreasing from year to year? F. As of 2021, which compony reports a more favorable fetum on assets and is this primari y attributable to its asset turno profit margin? Answer is complete but not entirely correct. Complete this question by emtering your answers in the tobs below. The return on assets is a restat of the profit margin and the asset turnover. Decnonstrate this for Big store in 2021 by showing that the profit margin times the asset furnover equalu rehurt on asseta. \{Rand yout animest to 2 decinal places. 8. Repeat the process one more time by creating a caliculated field "Asset. Turnover" that consists of "Net sales" divic total assets." 9. Drag the newy created "Rewin on Assets" to add it to the Rows shelf. Format it to discrete Right click on Return click Format. On the left, you will see a format bat. Under Default, choose Alignment, then Horizontat Center Then Numbers and choose Percentage 10. Drag the newly created "Profit Margin on Sales" and "Asset Tumover" to the Rows shelf. Format them both as disct aligned. "Profit Margin on Sales" should be formatted as percentage. "Asset Turnover" should be formatted as Num with 2 decimal places 11. Right-click the "Net income? (6os5), " Net sales," and "Average total assets" on the Rows shelf and un-select" Show will hide these ilems from view but still allow them to be used in formulas. 12 Double-click the tab at the bottom of the page and type Profitability Ratios to change the name of the sheet. 13. To hide the abc column, which appears when all variables are discrete, click on the Marks Card, and choose Polygc hide the letters. Then click and drag the edge of the column to make it as small as possible. Assets," "Proft Margin on Sales" and "Asset Turnover" to the Rows shelf. 15. Drag "Company" under Fables to "Color" on the "Ar" section of the Marks card You should now see two lines in eac graphs 16. Double-click the tab at the bottom of the page and type Graph of Protitabilty Ratios to change the name of the shee 17. Save your work Required: Based on the visualization you created, answer the following questipns A. What is the Big Store's return on assets in (a) 2012 and (b) 2021? B. What is the Discount Goods's return on assets in (a) 2012 and (b) 2021 ? To heip detemine why the relative profitabinity of the two companies has shifted over the ten-year period and to get a betti to-company comparison, drag the second "per. (Yeer Dimension) to the left of the "pill (Company Dimension in the text ch C. The teturn on assets is a result of the profit margin and the asset furnovec. Demonstrate this for Big Store in 2021 by. 5 the profit margin times the asset turnover equals return on assets, D. Analyzing the asset turnover ratios over the tenyear period, is Big. Stores asset turnover (a) generally increasing. (b) a same, of (c) generally decreasing from year to year? E. Analyzing the asset turnover ratios over the tenyear penod, is Discount Goods turnover (a) generally increasing, (b) ic same, or (c) generally decreasing from year to year? F. As of 2021, which compony reports a more favorable fetum on assets and is this primari y attributable to its asset turno profit margin? Answer is complete but not entirely correct. Complete this question by emtering your answers in the tobs below. The return on assets is a restat of the profit margin and the asset turnover. Decnonstrate this for Big store in 2021 by showing that the profit margin times the asset furnover equalu rehurt on asseta. \{Rand yout animest to 2 decinal places


