

Answered step by step
Verified Expert Solution
Question
1 Approved Answer
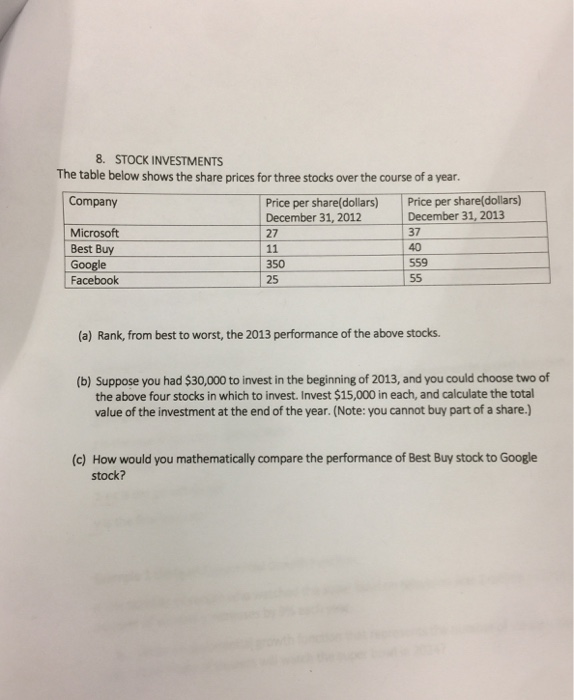
8. STOCK INVESTMENTS The table below shows the share prices for three stocks over the course of a year. Company Price per share(dollars) Price per
Step by Step Solution
There are 3 Steps involved in it
Step: 1

Get Instant Access to Expert-Tailored Solutions
See step-by-step solutions with expert insights and AI powered tools for academic success
Step: 2

Step: 3
Ace Your Homework with AI
Get the answers you need in no time with our AI-driven, step-by-step assistance
Get Started
Fundamental Financial Accounting Concepts
Authors: J.K.
7th Edition
B003NPRW7I