Answered step by step
Verified Expert Solution
Question
1 Approved Answer
8 The infrared spectrum in Figure 2 is of an unknown compound. Figure 2:The infrared spectrum of the unknown compound The compound is a colourless
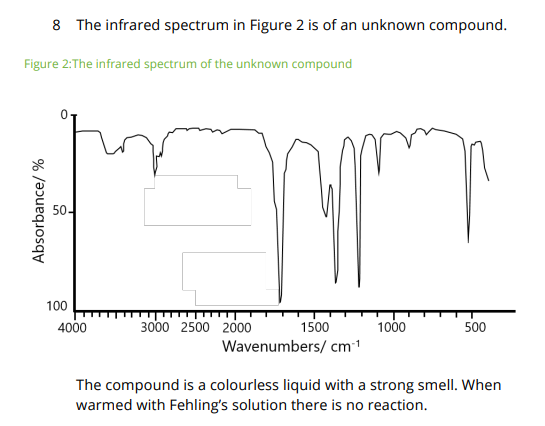
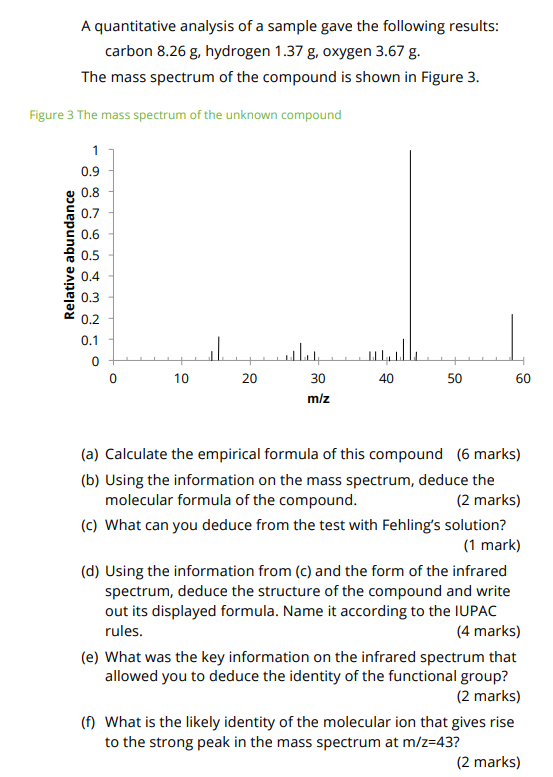
8 The infrared spectrum in Figure 2 is of an unknown compound. Figure 2:The infrared spectrum of the unknown compound The compound is a colourless liquid with a strong smell. When warmed with Fehling's solution there is no reaction. A quantitative analysis of a sample gave the following results: carbon 8.26g, hydrogen 1.37g, oxygen 3.67g. The mass spectrum of the compound is shown in Figure 3. Figure 3 The mass spectrum of the unknown compound (a) Calculate the empirical formula of this compound (6 marks) (b) Using the information on the mass spectrum, deduce the molecular formula of the compound. (2 marks) (c) What can you deduce from the test with Fehling's solution? (1 mark) (d) Using the information from (c) and the form of the infrared spectrum, deduce the structure of the compound and write out its displayed formula. Name it according to the IUPAC rules. (4 marks) (e) What was the key information on the infrared spectrum that allowed you to deduce the identity of the functional group? (2 marks) (f) What is the likely identity of the molecular ion that gives rise to the strong peak in the mass spectrum at m/z=43 ? (2 marks)
Step by Step Solution
There are 3 Steps involved in it
Step: 1
Get Instant Access to Expert-Tailored Solutions
See step-by-step solutions with expert insights and AI powered tools for academic success
Step: 2
Step: 3
Ace Your Homework with AI
Get the answers you need in no time with our AI-driven, step-by-step assistance
Get Started