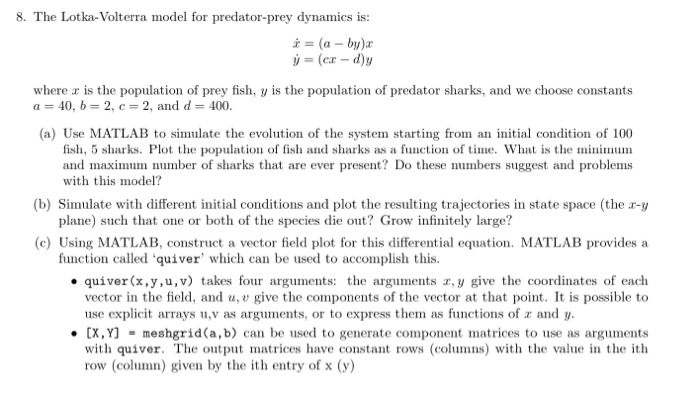
8. The Lotka-Volterra model for predator-prey dynamics is where r is the population of prey fish, y is the population of predator sharks, and we choose constants a-40, b-2, c 2, and d-400 (a) Use MATLAB to simulate the evolution of the system starting from an initial condition of 100 fish, 5 sharks. Plot the population of fish and sharks as a function of time. What is the minimum and maximum number of sharks that are ever present? Do these numbers suggest and problems with this model? (b) Simulate with different initial conditions and plot the resulting trajectories in state space (the r-ry plane) such that one or both of the species die out? Grow infinely large? (c) Using MATLAB, construct a vector field plot for this differential equation. MATLAB provides a function called 'quiver which can be used to accomplish this. quiver(x,y,u,v) takes four arguments: the arguments z, y give the coordinates of each vector in the field, and u, v give the components of the vector at that point. It is possible to use explicit arrays u,v as arguments, or to express them as functions of z andy [x,Y- meshgrid (a,b) can be used to generate component matrices to use as arguments with quiver. The output matrices have constant rows (columns) with the value in the ith row (column) given by the ith entry of x (y) 8. The Lotka-Volterra model for predator-prey dynamics is where r is the population of prey fish, y is the population of predator sharks, and we choose constants a-40, b-2, c 2, and d-400 (a) Use MATLAB to simulate the evolution of the system starting from an initial condition of 100 fish, 5 sharks. Plot the population of fish and sharks as a function of time. What is the minimum and maximum number of sharks that are ever present? Do these numbers suggest and problems with this model? (b) Simulate with different initial conditions and plot the resulting trajectories in state space (the r-ry plane) such that one or both of the species die out? Grow infinely large? (c) Using MATLAB, construct a vector field plot for this differential equation. MATLAB provides a function called 'quiver which can be used to accomplish this. quiver(x,y,u,v) takes four arguments: the arguments z, y give the coordinates of each vector in the field, and u, v give the components of the vector at that point. It is possible to use explicit arrays u,v as arguments, or to express them as functions of z andy [x,Y- meshgrid (a,b) can be used to generate component matrices to use as arguments with quiver. The output matrices have constant rows (columns) with the value in the ith row (column) given by the ith entry of x (y)


