Answered step by step
Verified Expert Solution
Question
1 Approved Answer
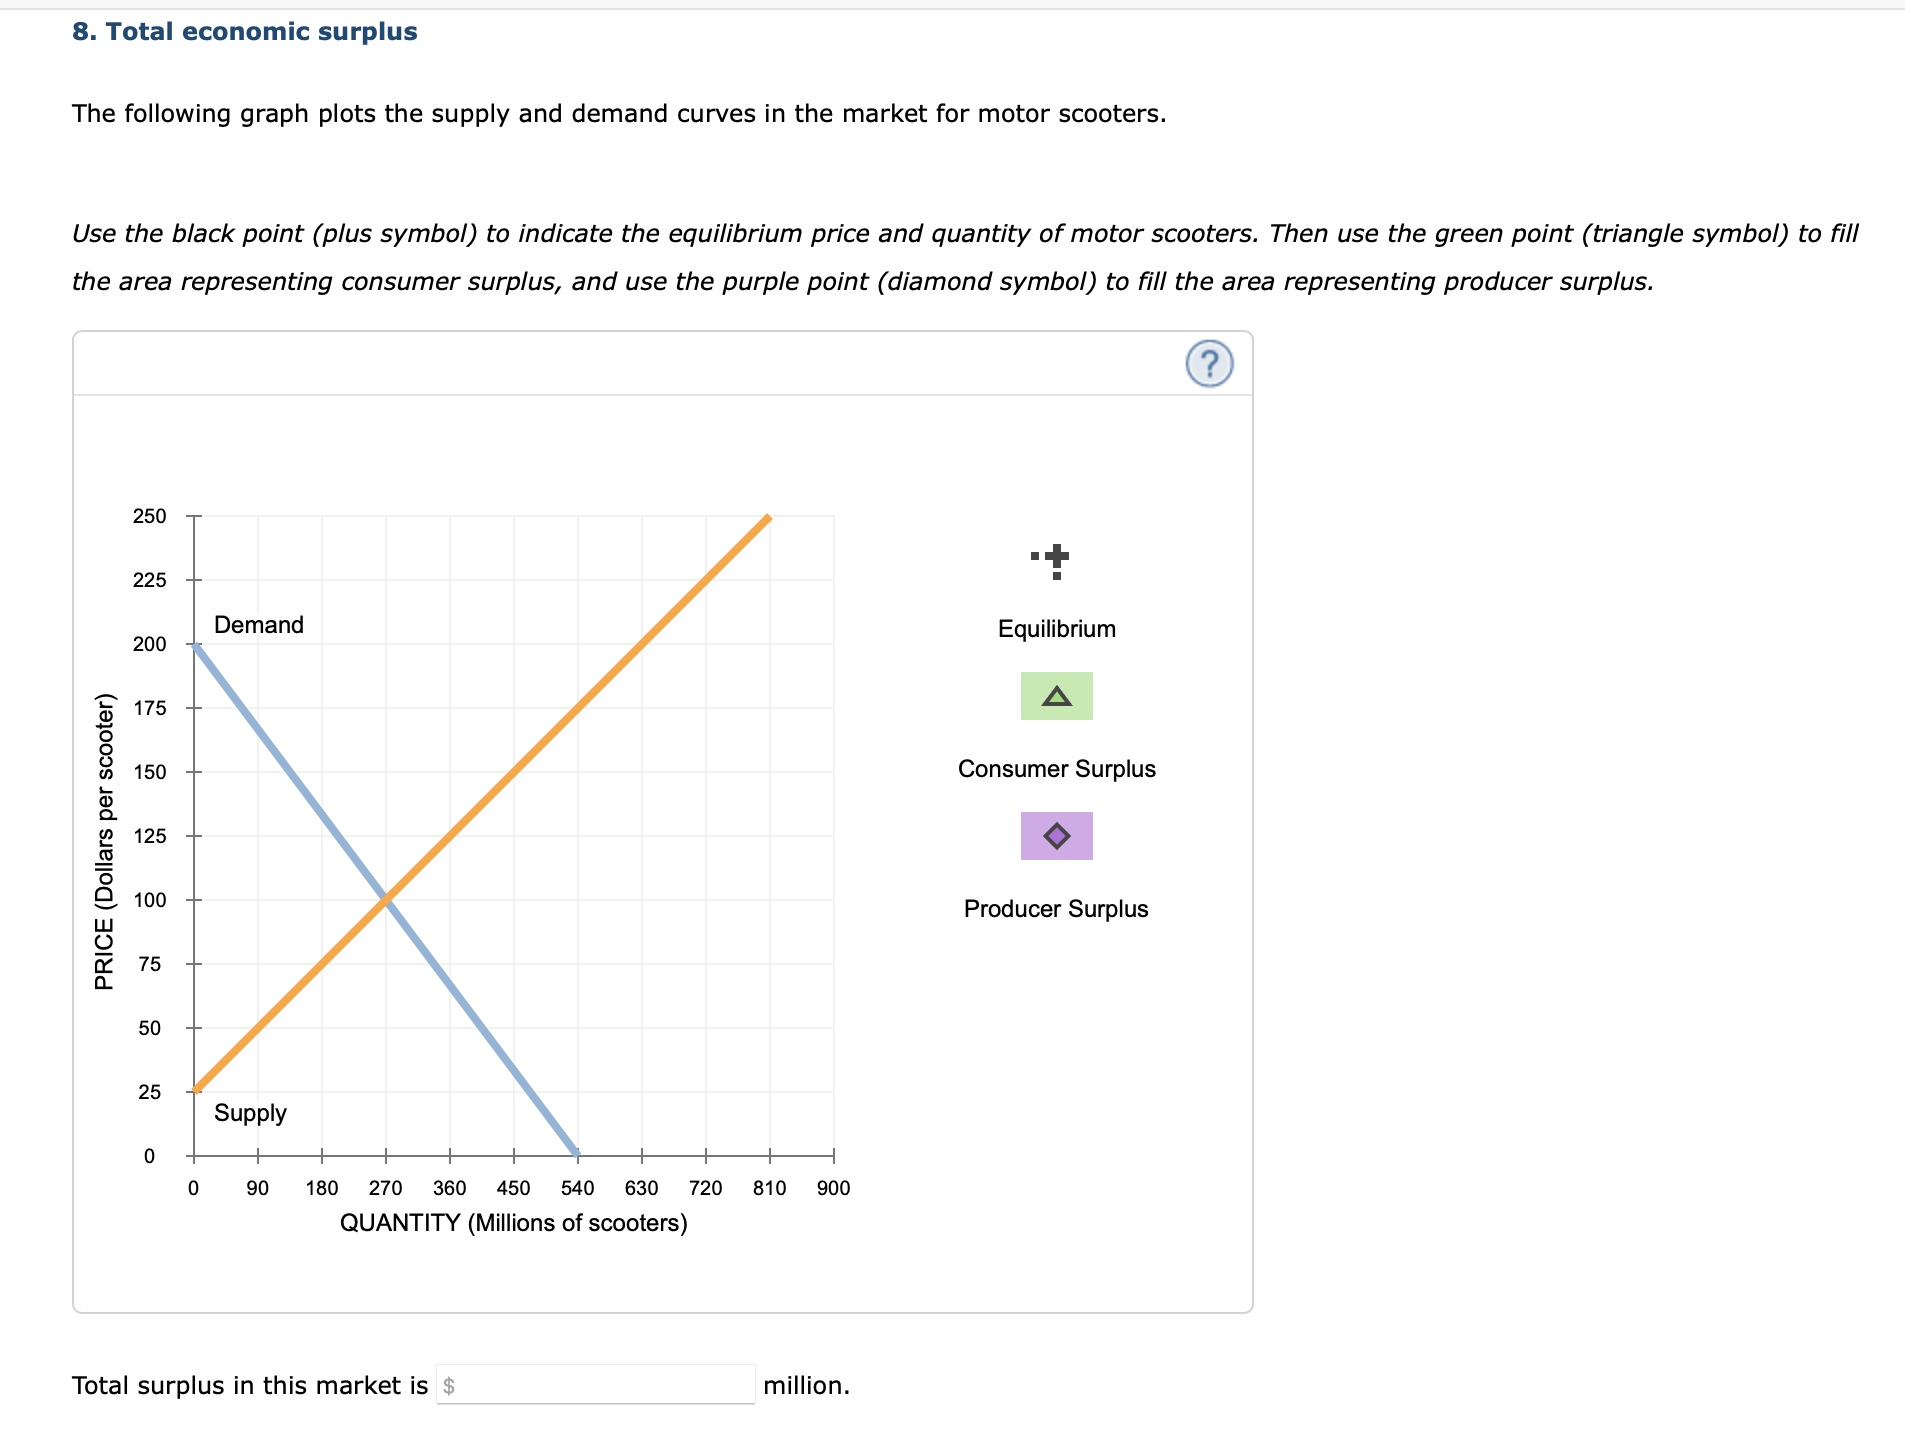
8. Total economic surplus The following graph plots the supply and demand curves in the market for motor scooters. Use the black point (plus symbol)

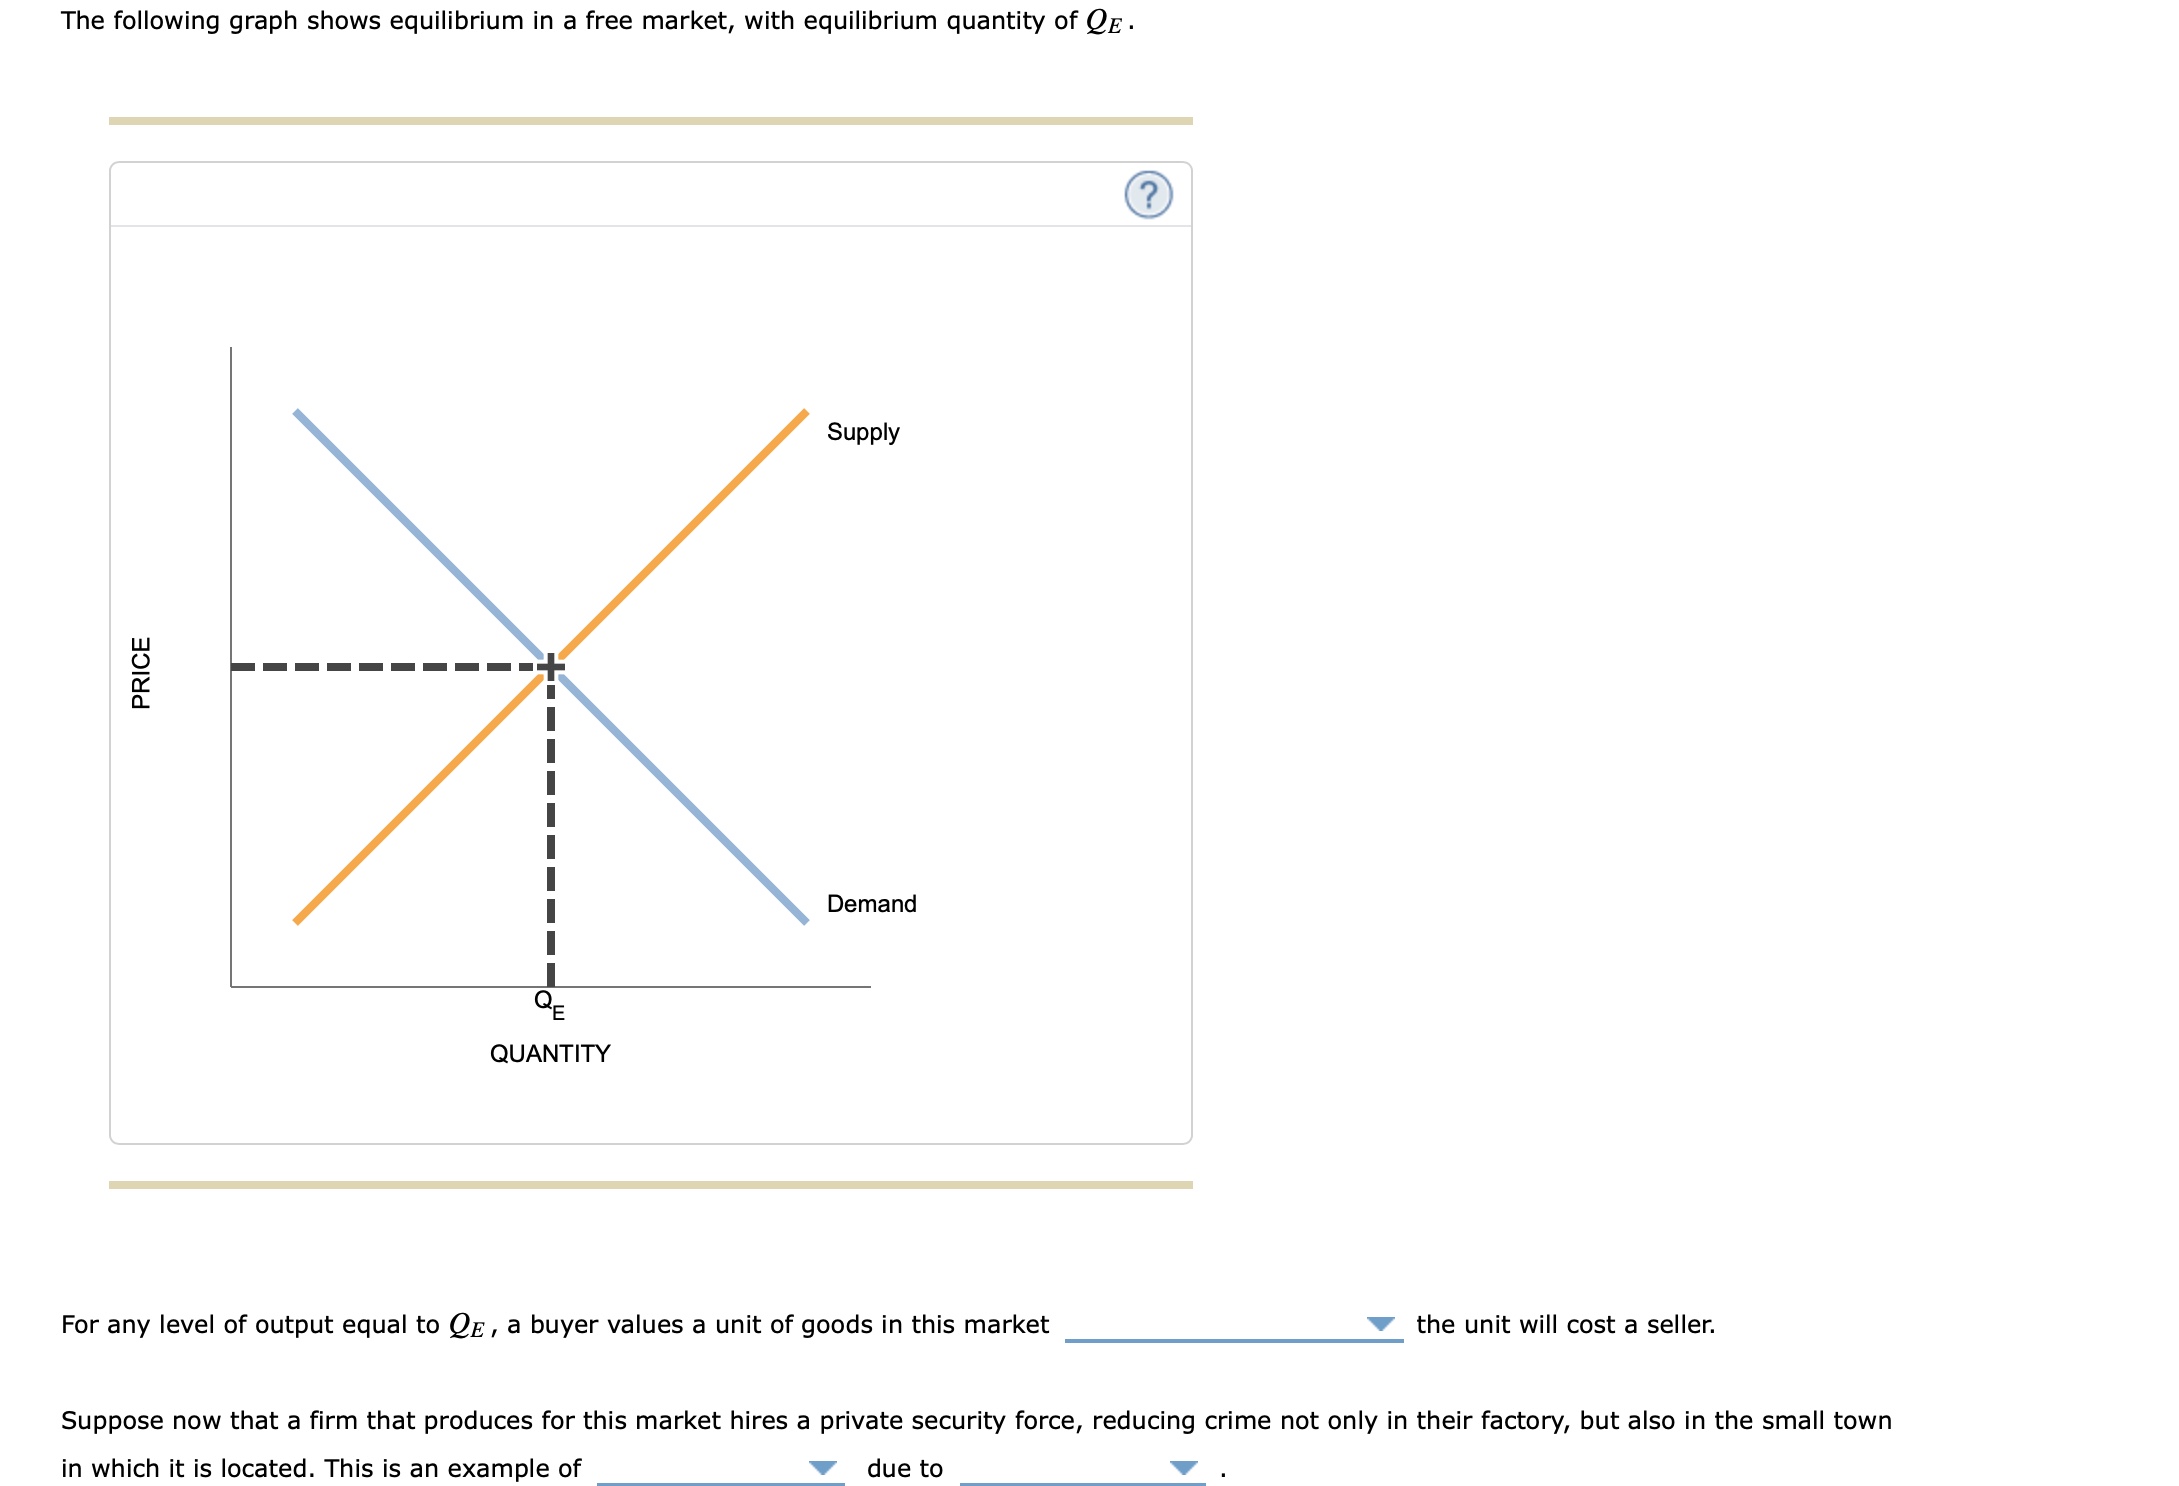
 8. Total economic surplus The following graph plots the supply and demand curves in the market for motor scooters. Use the black point (plus symbol) to indicate the equilibrium price and quantity of motor scooters. Then use the green point (triangle symbol) to fill the area representing consumer surplus, and use the purple point (diamond symbol) to fill the area representing producer surplus. Total surplus in this market is million. The following graph shows equilibrium in a free market, with equilibrium quantity of QE. For any level of output equal to QE, a buyer values a unit of goods in this market the unit will cost a seller. Suppose now that a firm that produces for this market hires a private security force, reducing crime not only in their factory, but also in the small town in which it is located. This is an example of due to
 Step by Step Solution
There are 3 Steps involved in it
Step: 1

Get Instant Access to Expert-Tailored Solutions
See step-by-step solutions with expert insights and AI powered tools for academic success
Step: 2

Step: 3

Ace Your Homework with AI
Get the answers you need in no time with our AI-driven, step-by-step assistance
Get Started


