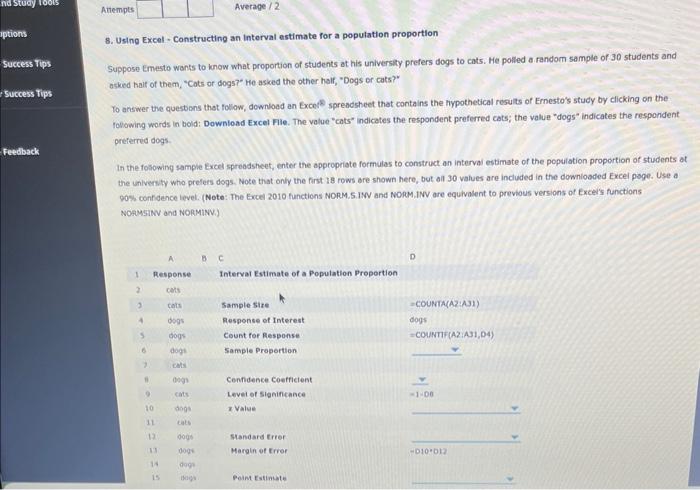
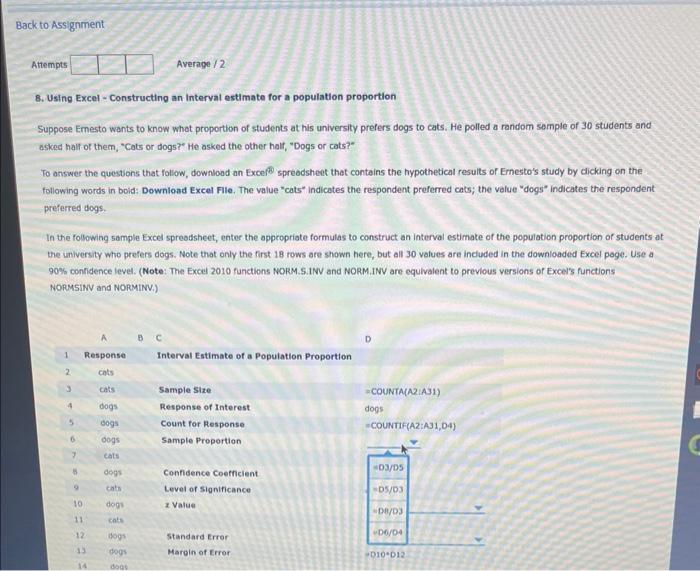
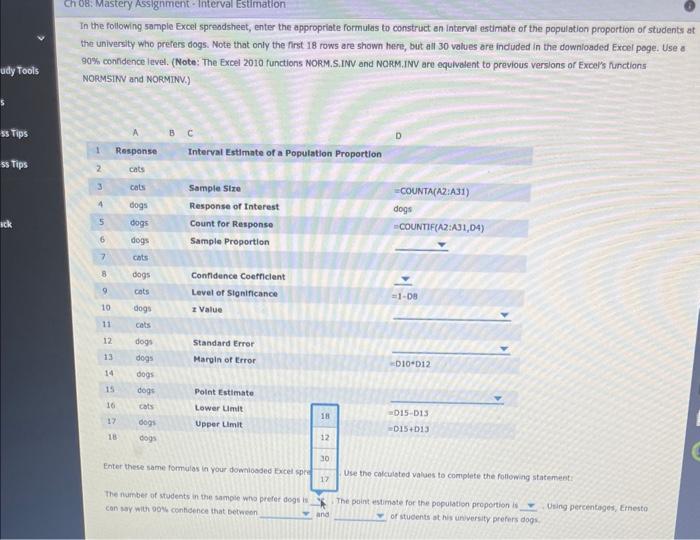
8. Using Excel - Constructing an Interval estimate for a population proportion Suppose Emesto wants to know what proportion of students at his universily prefers dogs to cats. He polled a random sample of 30 students and asked half of them, "Cats of dogs?" He asked the other half, "Dogs or cats?" To answer the questons that foliow, downioad an Excet? spreadsheet that contains the hypothetical results of Ernesto's study by clicking on the folowing words in bold: Download Excel Flle. The volue "cats" indicates the respondent preferred cats; the value "dogs" indicates the respondent preferred dogs. In the fosowing sample Excel spreodsheet, enter the appropriate formulas to construct an interval estimate of the population proportion of students at the universty who prefers dogs. Note that only the first 18 rows are shown here, but ail 30 values are included in the downioaded Excel poge. Use a poes confidence level. (Nete: The Excel 2010 functions NORM.S.INY and NOPM.INV are equivalent to previous versions of Excel's functions sogMsikv and NORMINV.) 8. Using Excel - Constructing an Interval estimate for a population proportion Suppose Emesto wants to know what proportion of students at his university prefers dogs to cats. He polled a random semple of 30 students and asked half of them, "Cats or dogs?" He asked the other halr, "Dogs or cats?" To answer the questons that foliow, download an Excef 2 spreadsheet that contains the hypothetical resuits of Emesto's study by clicking on the following words in boid: Download Excel Flie. The value "cats" indicates the respondent preferred cats; the velue "dogs" indicates the respondent preferred dogs. In the following sample Excel spreodsheet, enter the appropriate formulas to construct an interval estimate of the population proportion of students at the university who prefers dogs. Note that only the first 18 rows are shown here, but all 30 values are included in the downloaded Excel page. Use a 90\% contidence level. (Note: The Excel 2010 functions NORM. S.INV and NORM.INV are equivalent to previous versions of Excels functions NORMSINV and NORMINV.) en 08:Mastery Assignment - Interval Estimation In the following sample Excel spreadsheet; enter the appropriate formulas to construct an interval estimate of the population proportion of students at the university who prefers dogs. Note that only the frst 18 rows are shown here, but all 30 values are induded in the downloaded Excel poge. Use a 90% connidence level. (Note: The Excel 2010 functions NORM.S.INV and NORM.INV are equlvalent to previous verslons of Excels functions NORMSINV and NORMINV.) The nurnber of students in the sampse who prefer dogs is a. The point estimate for the population proportion is =, Oving percentages, Einesto. con say with 904 conficence that betweon and of stucents at his unversity prefers dogs