Answered step by step
Verified Expert Solution
Link Copied!

Question

1 Approved Answer

8. Using the X (10) & the Y (GPA) data, compute the Pearson=5 correlation coefficient (create a table for your calculations). Is there a relationship?
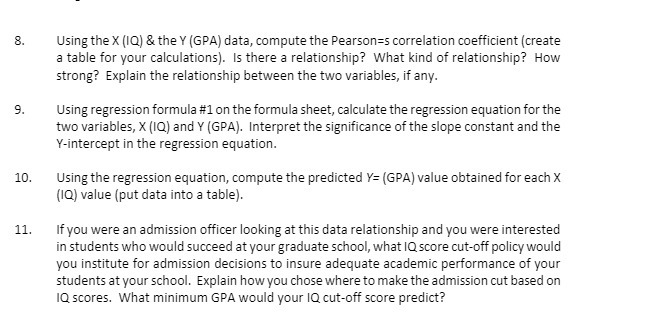
image text in transcribed
8. Using the X (10) & the Y (GPA) data, compute the Pearson=5 correlation coefficient (create a table for your calculations). Is there a relationship? What kind of relationship? How strong? Explain the relationship between the two variables, if any. 9. Using regression formula #1 on the formula sheet, calculate the regression equation for the two variables, X (IQ) and Y (GPA). Interpret the significance of the slope constant and the Y-intercept in the regression equation. 10. Using the regression equation, compute the predicted Y= (GPA) value obtained for each X (1Q) value (put data into a table). 11. If you were an admission officer looking at this data relationship and you were interested in students who would succeed at your graduate school, what IQ score cut-off policy would you institute for admission decisions to insure adequate academic performance of your students at your school. Explain how you chose where to make the admission cut based on IQ scores. What minimum GPA would your IQ cut-off score predict

Step by Step Solution

There are 3 Steps involved in it

Step: 1

blur-text-image

Get Instant Access to Expert-Tailored Solutions

See step-by-step solutions with expert insights and AI powered tools for academic success

Step: 2

blur-text-image_2

Step: 3

blur-text-image_3

Ace Your Homework with AI

Get the answers you need in no time with our AI-driven, step-by-step assistance

Get Started

Recommended Textbook for

Linear Algebra with Applications

Authors: Steven J. Leon

7th edition

131857851, 978-0131857858

More Books

Students also viewed these Mathematics questions