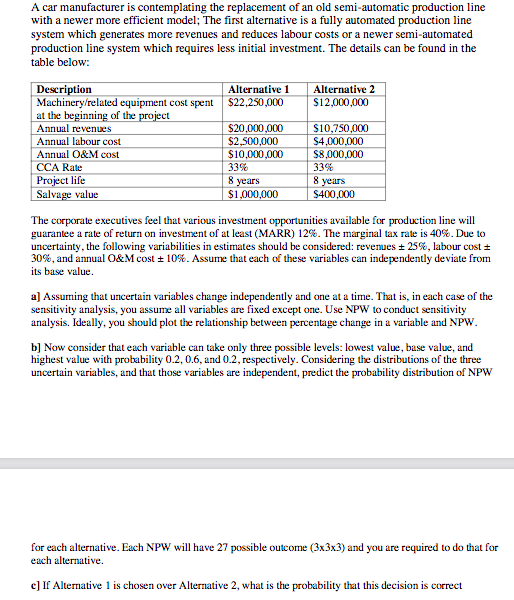
8 years 8 years A car manufacturer is contemplating the replacement of an old semi-automatic production line with a newer more efficient model; The first alternative is a fully automated production line system which generates more revenues and reduces labour costs or a newer semi-automated production line system which requires less initial investment. The details can be found in the table below: Description Alternative 1 Alternative 2 Machinery/related equipment cost spent $22,250,000 $12,000,000 at the beginning of the project Annual revenues $20,000,000 $10,750,000 Annual labour cost $2,500,000 $4.000.000 Annual O&M cost $10,000,000 $8,000,000 CCA Rate 33% 33% Project life Salvage value $1,000,000 $400,000 The corporate executives feel that various investment opportunities available for production line will guarantee a rate of return on investment of at least (MARR) 12%. The marginal tax rate is 40%. Due to uncertainty, the following variabilities in estimates should be considered: revenues + 25%, labour cost 30%, and annual O&M cost + 10%. Assume that each of these variables can independently deviate from its base value a) Assuming that uncertain variables change independently and one at a time. That is, in each case of the sensitivity analysis, you assume all variables are fixed except one. Use NPW to conduct sensitivity analysis. Ideally, you should plot the relationship between percentage change in a variable and NPW. b] Now consider that each variable can take only three possible levels: lowest value, base value, and highest value with probability 0.2, 0.6, and 0.2, respectively. Considering the distributions of the three uncertain variables, and that those variables are independent, predict the probability distribution of NPW for each alternative. Each NPW will have 27 possible outcome (3x3x3) and you are required to do that for each alternative. c] If Alternative 1 is chosen over Alternative 2, what is the probability that this decision is correct 8 years 8 years A car manufacturer is contemplating the replacement of an old semi-automatic production line with a newer more efficient model; The first alternative is a fully automated production line system which generates more revenues and reduces labour costs or a newer semi-automated production line system which requires less initial investment. The details can be found in the table below: Description Alternative 1 Alternative 2 Machinery/related equipment cost spent $22,250,000 $12,000,000 at the beginning of the project Annual revenues $20,000,000 $10,750,000 Annual labour cost $2,500,000 $4.000.000 Annual O&M cost $10,000,000 $8,000,000 CCA Rate 33% 33% Project life Salvage value $1,000,000 $400,000 The corporate executives feel that various investment opportunities available for production line will guarantee a rate of return on investment of at least (MARR) 12%. The marginal tax rate is 40%. Due to uncertainty, the following variabilities in estimates should be considered: revenues + 25%, labour cost 30%, and annual O&M cost + 10%. Assume that each of these variables can independently deviate from its base value a) Assuming that uncertain variables change independently and one at a time. That is, in each case of the sensitivity analysis, you assume all variables are fixed except one. Use NPW to conduct sensitivity analysis. Ideally, you should plot the relationship between percentage change in a variable and NPW. b] Now consider that each variable can take only three possible levels: lowest value, base value, and highest value with probability 0.2, 0.6, and 0.2, respectively. Considering the distributions of the three uncertain variables, and that those variables are independent, predict the probability distribution of NPW for each alternative. Each NPW will have 27 possible outcome (3x3x3) and you are required to do that for each alternative. c] If Alternative 1 is chosen over Alternative 2, what is the probability that this decision is correct