Answered step by step
Verified Expert Solution
Question
1 Approved Answer
8.22 The following table lists the rates of return for 10 years on Chevron and Mobil (both energy firms) and on Sears and United States
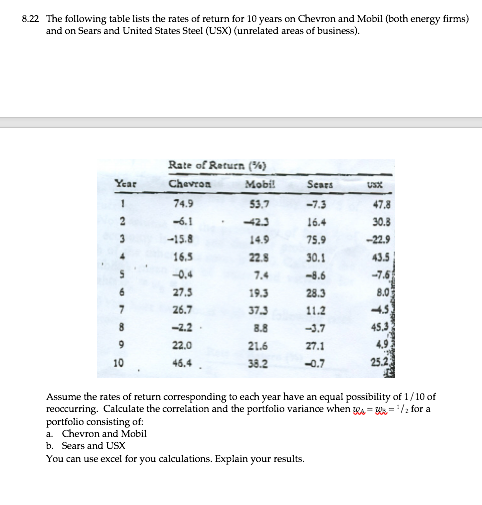
8.22 The following table lists the rates of return for 10 years on Chevron and Mobil (both energy firms) and on Sears and United States Steel (L'SX) (unrelated areas of business). Year Scars 1 47.8 2 3 -7.3 16.4 75.9 30.1 30.3 -22.9 43.5 4 Rate of Return (%) Chevron Mobil 74.9 53.7 -6.1 42.3 - 15.8 14.9 16.5 22.8 -0.4 7.4 27.3 19.3 26.7 37,3 -2.2 8.8 22.0 21.6 46.4 38.2 -7.5 S 6 7 8 -8.6 28.3 11.2 -3.7 8.0 4.5 45.3 4,9 25.2 9 27.1 10 -0.7 Assume the rates of return corresponding to each year have an equal possibility of 1/10 of reoccurring. Calculate the correlation and the portfolio variance when 24 = x= 1/3 for a portfolio consisting of: a Chevron and Mobil b. Sears and USX You can use excel for you calculations. Explain your results. 8.22 The following table lists the rates of return for 10 years on Chevron and Mobil (both energy firms) and on Sears and United States Steel (L'SX) (unrelated areas of business). Year Scars 1 47.8 2 3 -7.3 16.4 75.9 30.1 30.3 -22.9 43.5 4 Rate of Return (%) Chevron Mobil 74.9 53.7 -6.1 42.3 - 15.8 14.9 16.5 22.8 -0.4 7.4 27.3 19.3 26.7 37,3 -2.2 8.8 22.0 21.6 46.4 38.2 -7.5 S 6 7 8 -8.6 28.3 11.2 -3.7 8.0 4.5 45.3 4,9 25.2 9 27.1 10 -0.7 Assume the rates of return corresponding to each year have an equal possibility of 1/10 of reoccurring. Calculate the correlation and the portfolio variance when 24 = x= 1/3 for a portfolio consisting of: a Chevron and Mobil b. Sears and USX You can use excel for you calculations. Explain your results
Step by Step Solution
There are 3 Steps involved in it
Step: 1
Get Instant Access to Expert-Tailored Solutions
See step-by-step solutions with expert insights and AI powered tools for academic success
Step: 2
Step: 3
Ace Your Homework with AI
Get the answers you need in no time with our AI-driven, step-by-step assistance
Get Started