Answered step by step
Verified Expert Solution
Question
1 Approved Answer
831 Q AA JAVA, INC. Four-Year Selected Financial Data Years Ended January 31, 2019-2016 2019 Operating Results: Net Sales Revenue Cost of Goods Sold Interest
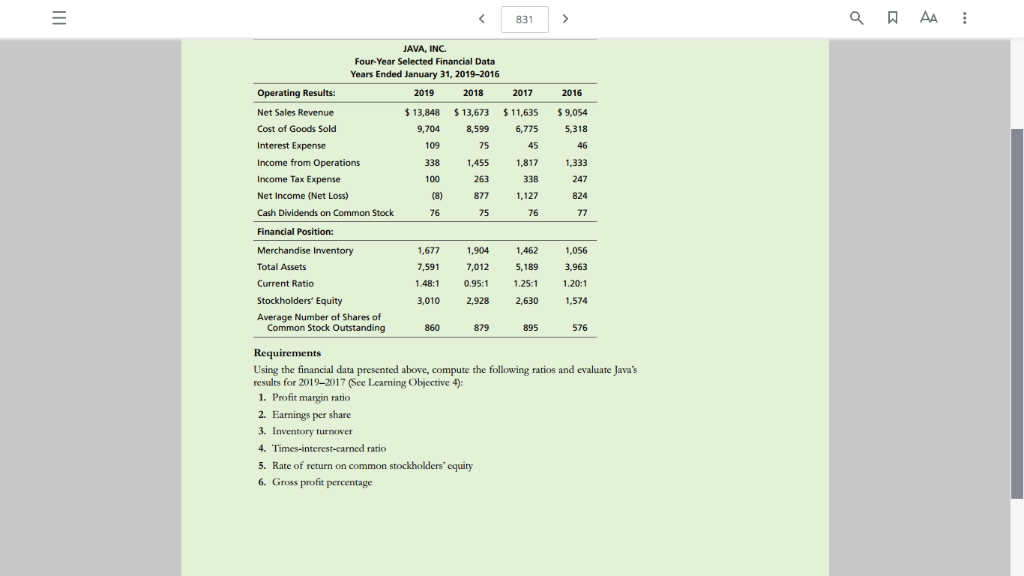
831 Q AA JAVA, INC. Four-Year Selected Financial Data Years Ended January 31, 2019-2016 2019 Operating Results: Net Sales Revenue Cost of Goods Sold Interest Expense Income from Operations Income Tax Expense Net Income (Net Loss) Cash Diwidends on Common Stock Financial Position: Merchandise Inventory Total Assets Current Ratio Stockholders Equity Average Number of Shares of 2018 2017 2016 13,848 $ 13,673 $11,635 $9,054 9,7048,599 6,775 5,318 109 338 100 75 1,817 338 1,127 76 1,455 1,333 877 76 75 1,904 ,056 ,012 5,189 3,963 1.20:1 1,574 1,677 1,462 1.48:1 0.95:1 1.25:1 3,010 Common Stock Outstanding 860 879 895 576 Using the financial data presented above, compute the following ratios and evaluate Java's results for 2019-2017 (See Learning Objective 4): 1. Profit margin ratio 2. Eanings per share 3. Inventory turnover 5. Rate of return on common stockholders' equity 6. Gross profit percentage
Step by Step Solution
There are 3 Steps involved in it
Step: 1
Get Instant Access to Expert-Tailored Solutions
See step-by-step solutions with expert insights and AI powered tools for academic success
Step: 2
Step: 3
Ace Your Homework with AI
Get the answers you need in no time with our AI-driven, step-by-step assistance
Get Started