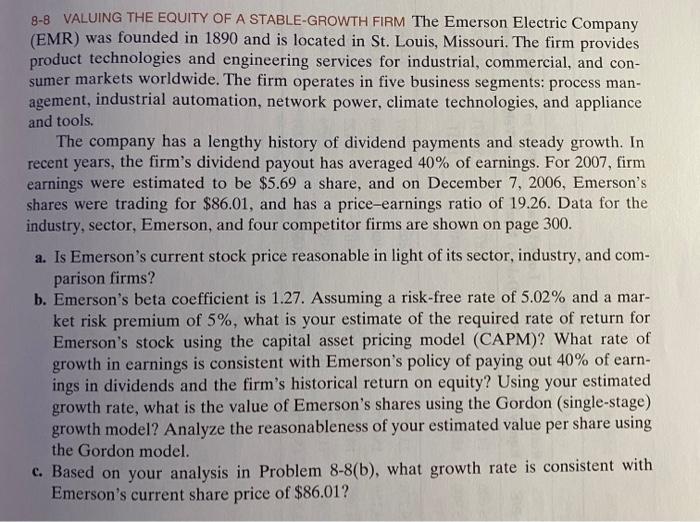
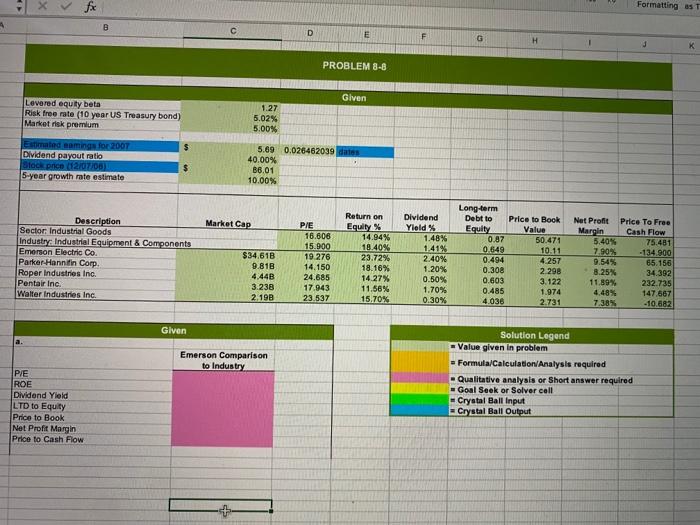
8-8 VALUING THE EQUITY OF A STABLE-GROWTH FIRM The Emerson Electric Company (EMR) was founded in 1890 and is located in St. Louis, Missouri. The firm provides product technologies and engineering services for industrial, commercial, and con- sumer markets worldwide. The firm operates in five business segments: process man- agement, industrial automation, network power, climate technologies, and appliance and tools. The company has a lengthy history of dividend payments and steady growth. In recent years, the firm's dividend payout has averaged 40% of earnings. For 2007, firm earnings were estimated to be $5.69 a share, and on December 7, 2006, Emerson's shares were trading for $86.01, and has a price-earnings ratio of 19.26. Data for the industry, sector, Emerson, and four competitor firms are shown on page 300. a. Is Emerson's current stock price reasonable in light of its sector, industry, and com- parison firms? b. Emerson's beta coefficient is 1.27. Assuming a risk-free rate of 5.02% and a mar- ket risk premium of 5%, what is your estimate of the required rate of return for Emerson's stock using the capital asset pricing model (CAPM)? What rate of growth in earnings is consistent with Emerson's policy of paying out 40% of earn- ings in dividends and the firm's historical return on equity? Using your estimated growth rate, what is the value of Emerson's shares using the Gordon (single-stage) growth model? Analyze the reasonableness of your estimated value per share using the Gordon model. c. Based on your analysis in Problem 8-8(b), what growth rate is consistent with Emerson's current share price of $86.01? X Formatting as B D E G PROBLEM 8-8 Given Levered equity beta Risk free rate (10 year US Treasury bond) Market risk premium 1.27 5.02% 5.00% $ Estimated Ramings for 2007 Dividend payout ratio Black price (12/07/06) 5-year growth rate estimate $ 5.69 0.026462039 dates 40.00% B6.01 10.00% Market Cap Description Sector Industrial Goods Industry Industrial Equipment & Components Emomon Electric Co. Parker Hannifin Corp. Roper Industries Inc. Pentair Inc. Walter Industries Inc $34.618 9.81B 4,44B 3.238 2.198 PIE 16.606 15.900 19.276 14.150 24.685 17.943 23.537 Return on Equity % 14.94% 18.40% 23.72% 18.16% 14.27% 11.56% 15.70% Dividend Yield 1.48% 1.41% 2.40% 1.20% 0.50% 1.70% 0.30% Long-term Debt to Price to Book Equity Value 0.87 50.471 0.549 10.11 0.494 4.257 0.308 2 298 0.603 3.122 0.485 1.974 4.036 2.731 Net Profit Price To Free Margin Cash Flow 5.40% 75.481 7.90% -134.900 9.54% 65.156 8.25% 34 302 11.89% 232.735 4,48% 147,567 7.38% -10.682 Given Emerson Comparison to Industry P/E ROE Dividend Yield LTD to Equity Price to Book Net Profit Margin Price to Cash Flow Solution Legend Value given in problem = Formula/Calculation Analysis required - Qualitative analysis or Short answer required - Goal Seek or Solver cell - Crystal Ball Input = Crystal Ball Output


