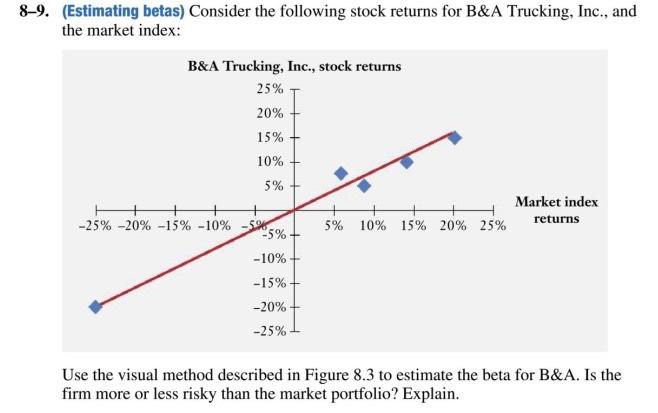
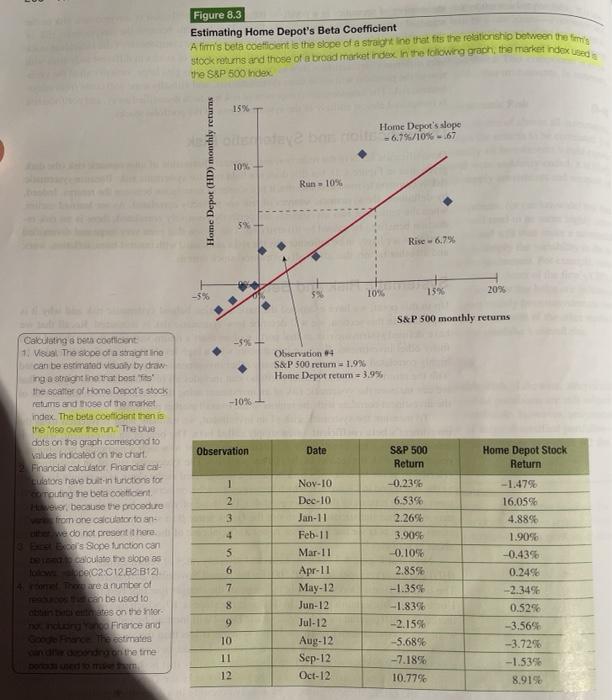
8-9. (Estimating betas) Consider the following stock returns for B&A Trucking, Inc., and the market index: B&A Trucking, Inc., stock returns 25% 20% 15% 10% 5% Market index returns -25% -20% -15% - 10% 5% 10% 15% 20% 25% -5% -5% -10% -15% -20% -25% Use the visual method described in Figure 8.3 to estimate the beta for B&A. Is the firm more or less risky than the market portfolio? Explain. Figure 8.3 Estimating Home Depot's Beta Coefficient A fim's beta coefficient is the slope of a straig in that fits the relationship between the time Stock returns and those of a broad market idee in the following grach, the market index the S&P 500 Index 15% T Home Depot's slope -6.7%/10% - 61 Home Depot (HD) monthly returns 10% Run 10% Rise 6.79 -3% 10 159 20% S&P 500 monthly returns Observation 4 S&P 500 retum = 1.996 Home Depot return = 3.9% -10% Observation Date S&P 500 Return Calculating a beta coint 1. Visual These of a sorentino can be estimated visual by draw ng a straight in that best the scatter of Home Decor's stock retums and those of the market index. The beta cooffident then is the Viso over the run. The dots on the graph correspond to values indicated on the chart Financial calculator Financial cal Lulators have built-in tunctions for Touting the beta coefficient ever because the procedure from one calculator to an We do not present there po's Se function can Decalculate the slope as opC2 C12.52 B12) U are a number of Dan be used to bates on the nter or Finance and The estimates dendron the time 1 2 3 4 -0.23% 6.53% 2.26% 3.90% -0.10% 2.85% -1.355 5 Nov-10 Dec-10 Jan-11 Feb-11 Mar-11 Apr-11 May-12 Jun-12 Jul-12 Aug-12 Sep-12 Oct-12 Home Depot Stock Return -1.47% 16.05% 4.889 1.90% -0.43% 0.2496 -2.3498 0.52% -3.569 -3.72% -1.5396 8.9198 6 7 8 9 10 11 -1.83% -2.15% -5.68% -7.18% 10.77% 12 8-9. (Estimating betas) Consider the following stock returns for B&A Trucking, Inc., and the market index: B&A Trucking, Inc., stock returns 25% 20% 15% 10% 5% Market index returns -25% -20% -15% - 10% 5% 10% 15% 20% 25% -5% -5% -10% -15% -20% -25% Use the visual method described in Figure 8.3 to estimate the beta for B&A. Is the firm more or less risky than the market portfolio? Explain. Figure 8.3 Estimating Home Depot's Beta Coefficient A fim's beta coefficient is the slope of a straig in that fits the relationship between the time Stock returns and those of a broad market idee in the following grach, the market index the S&P 500 Index 15% T Home Depot's slope -6.7%/10% - 61 Home Depot (HD) monthly returns 10% Run 10% Rise 6.79 -3% 10 159 20% S&P 500 monthly returns Observation 4 S&P 500 retum = 1.996 Home Depot return = 3.9% -10% Observation Date S&P 500 Return Calculating a beta coint 1. Visual These of a sorentino can be estimated visual by draw ng a straight in that best the scatter of Home Decor's stock retums and those of the market index. The beta cooffident then is the Viso over the run. The dots on the graph correspond to values indicated on the chart Financial calculator Financial cal Lulators have built-in tunctions for Touting the beta coefficient ever because the procedure from one calculator to an We do not present there po's Se function can Decalculate the slope as opC2 C12.52 B12) U are a number of Dan be used to bates on the nter or Finance and The estimates dendron the time 1 2 3 4 -0.23% 6.53% 2.26% 3.90% -0.10% 2.85% -1.355 5 Nov-10 Dec-10 Jan-11 Feb-11 Mar-11 Apr-11 May-12 Jun-12 Jul-12 Aug-12 Sep-12 Oct-12 Home Depot Stock Return -1.47% 16.05% 4.889 1.90% -0.43% 0.2496 -2.3498 0.52% -3.569 -3.72% -1.5396 8.9198 6 7 8 9 10 11 -1.83% -2.15% -5.68% -7.18% 10.77% 12