

Answered step by step
Verified Expert Solution
Question
1 Approved Answer
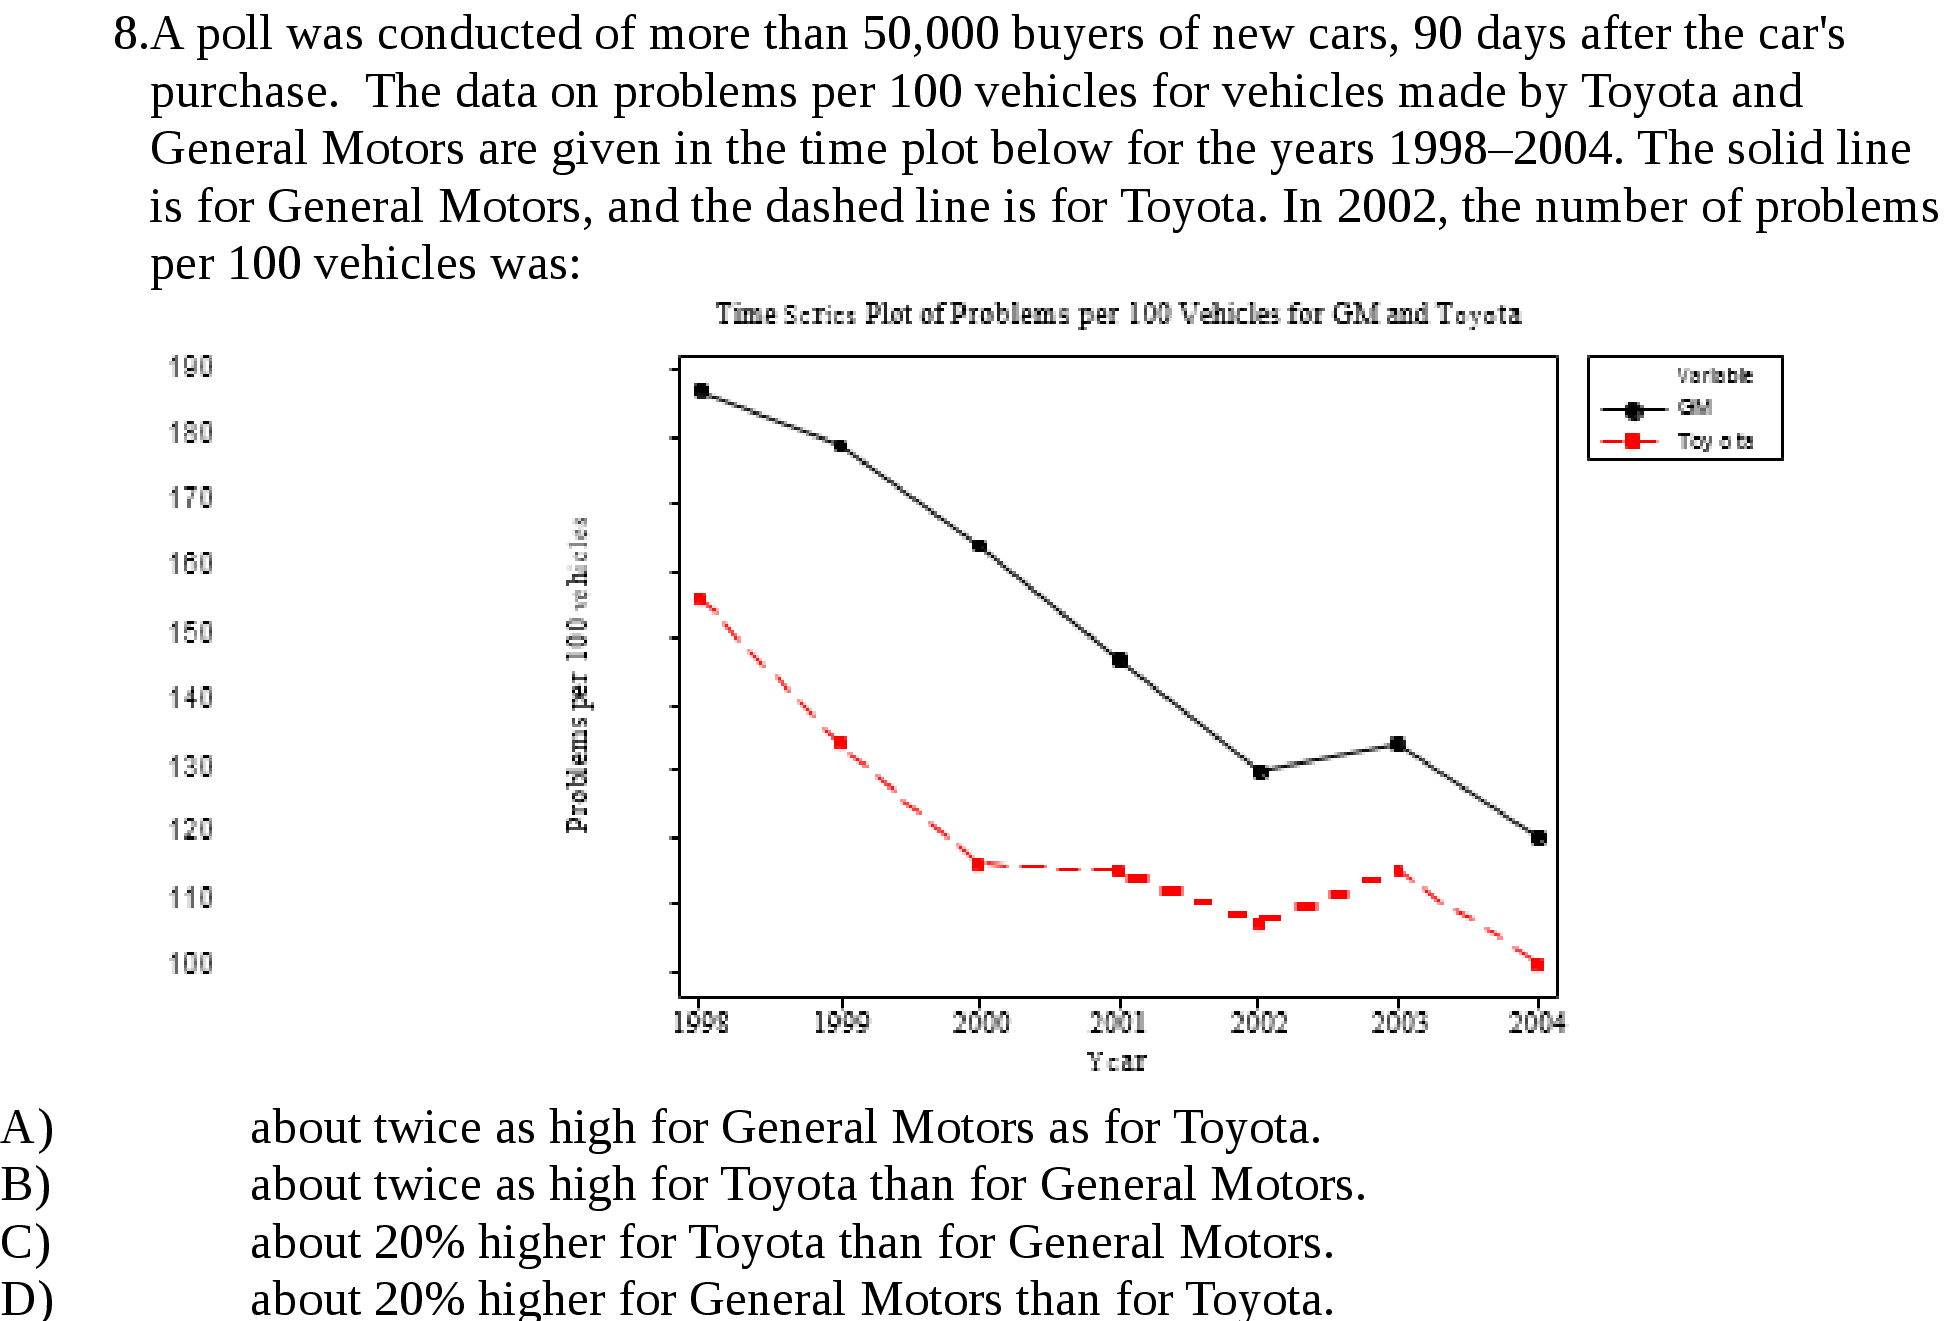
8.A poll was conducted of more than 50,000 buyers of new cars, 90 days after the car's purchase. The data on problems per 100 vehicles
Step by Step Solution
There are 3 Steps involved in it
Step: 1

Get Instant Access to Expert-Tailored Solutions
See step-by-step solutions with expert insights and AI powered tools for academic success
Step: 2

Step: 3
Ace Your Homework with AI
Get the answers you need in no time with our AI-driven, step-by-step assistance
Get Started
Big Ideas Math A Common Core Curriculum Blue
Authors: Ron Larson, Laurie Boswell
1st Edition
1608402282, 978-1608402281