

Question
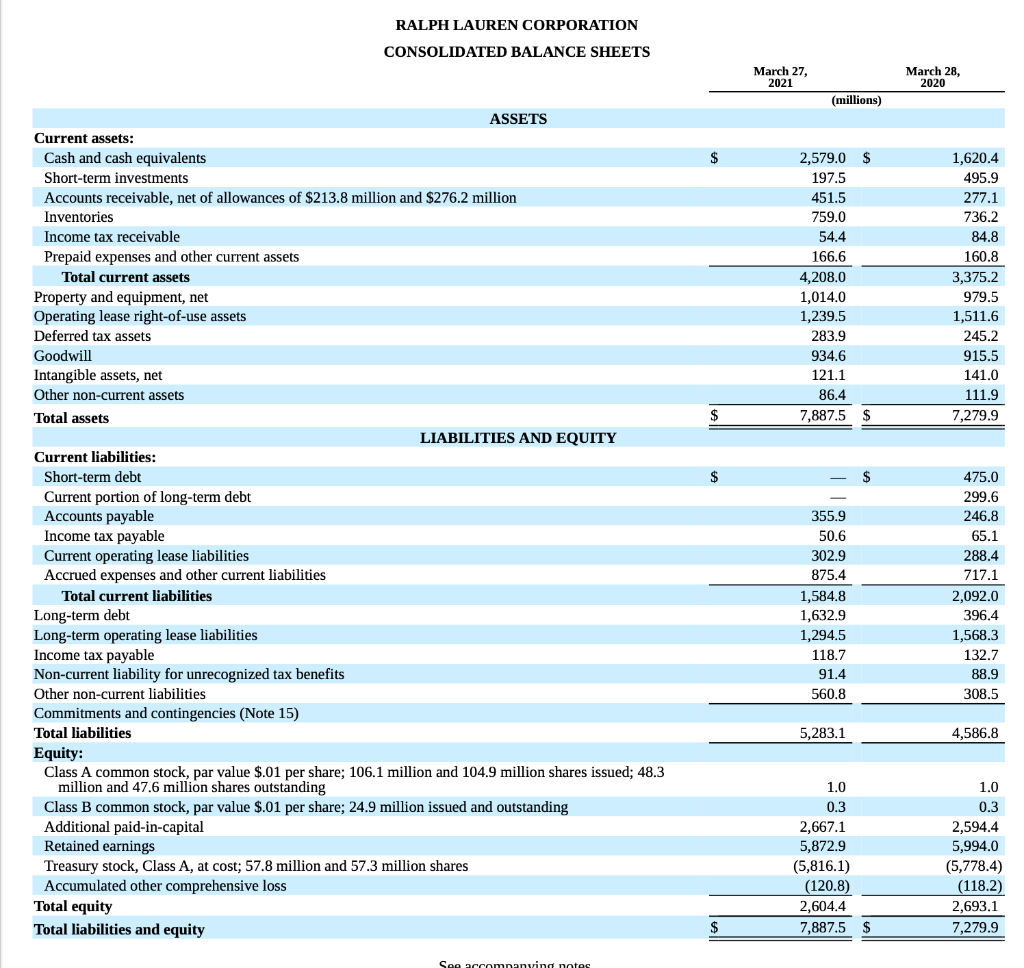
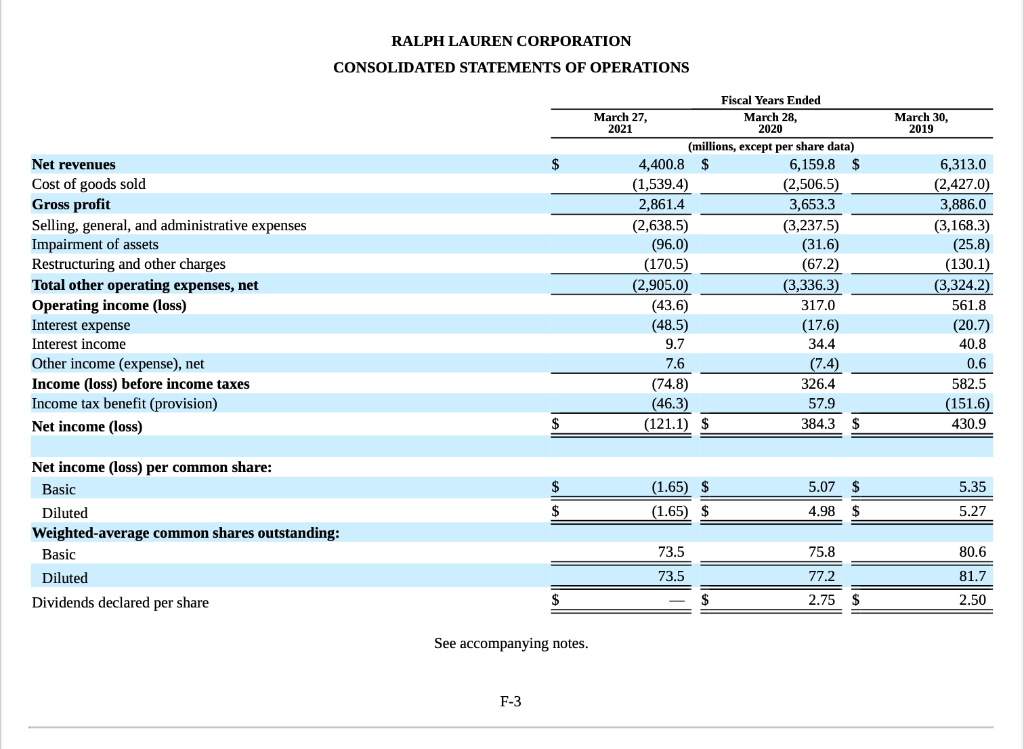
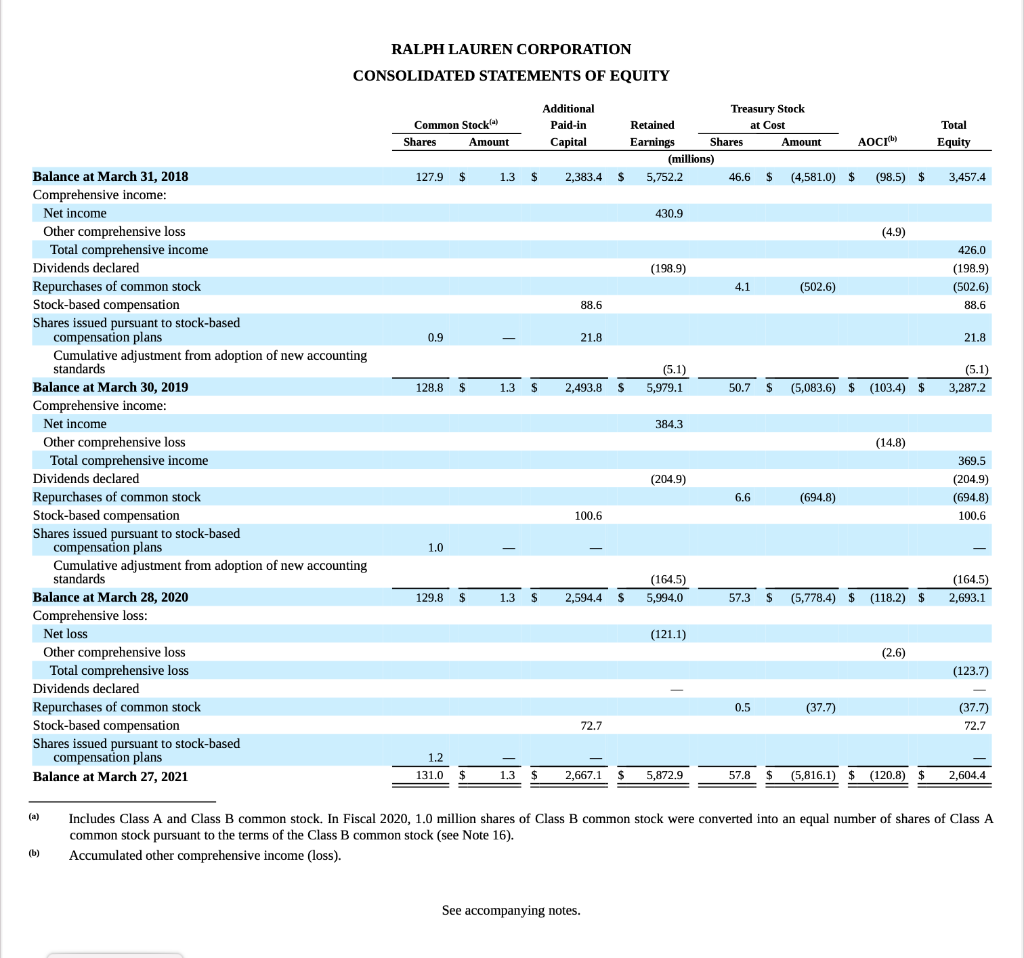
8b. Compute ROE for all years presented on the income statement. (See # 1 on page 4-58 Ongoing Project for more details on tips to
8b. Compute ROE for all years presented on the income statement. (See # 1 on page 4-58 Ongoing Project for more details on tips to do this).
Compute RNOA and its two components (NOPM and NOAT) for all years presented on the income statement. (See # 2 on page 4-58 Ongoing Project for more details on tips to do this).
Step by Step Solution
There are 3 Steps involved in it
Step: 1

Get Instant Access to Expert-Tailored Solutions
See step-by-step solutions with expert insights and AI powered tools for academic success
Step: 2

Step: 3
Ace Your Homework with AI
Get the answers you need in no time with our AI-driven, step-by-step assistance
Get Started
Financial Accounting
Authors: Jerry J. Weygandt, Paul D. Kimmel, Donald E. Kieso
7th Edition
978-0470477151, 978-0-470-5562, 470556242, 0-470-55624-2, 9780470556245, 978-0470507018