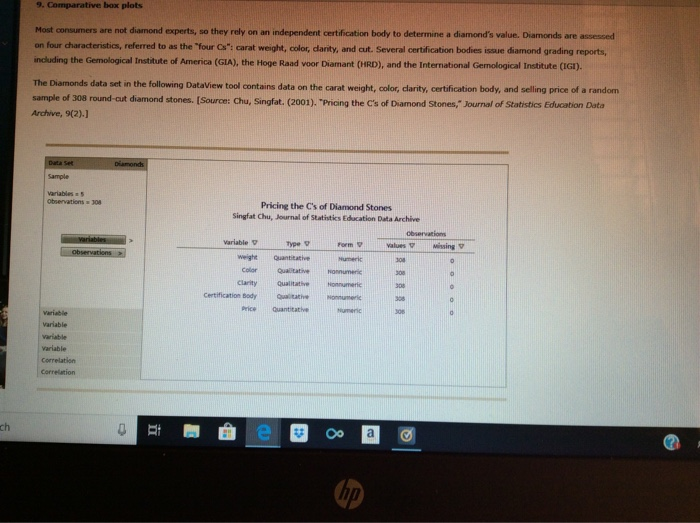
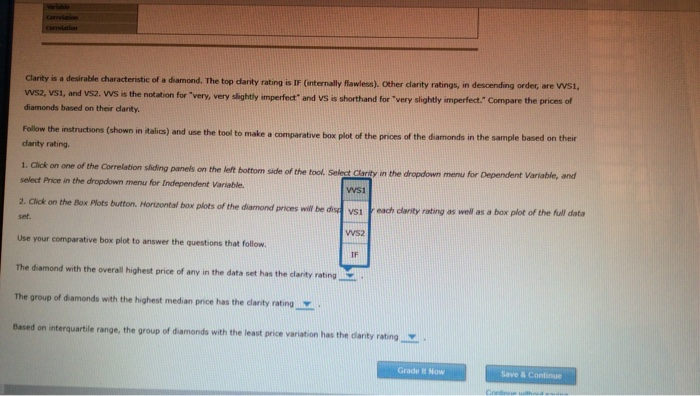
9. Comparative box plots Most consumers are not diamond experts, so they rely on an independent certification body to determine a diamond's value. Diamonds are assessed on four characteristics, referred to as the "four Cs": carat weight, color, dlarity, and cut. Several certification bodies issue diamond grading reports, including the Gemological Institute of America (GIA), the Hoge Raad voor Diamant (HRD), and the International Gemological Institute (IGI). The Diamonds data set in the following DataView tool contains data on the carat weight, color, clarity, certification body, and selling price of a random sample of 308 round-cut diamond stones. [Source: Chu, Singfat. (2001). "Pricing the C's of Diamond Stones," Journal of Statistics Education Data Archive, 9(2).] Data Set piamonds Sample variables 5 Observations308 Pricing the C's of Diamond Stones Singfat Chu, Journal of Statistks Education Data Archive observations variables Variable Type values Missing Form Observations weight Quantitative qualitative Humeric 308 Color Nonnumeric 308 clarity certification Body Qualitative Honnumeric Qualitathe Nonnumeric Price Quantitathve Humeria variable variable variable variable Correlation Correlation ch hp rlabde Corelation Correlation Clarity is a desirable characteristic of a diamond. The top darity rating is IF (internally flawless), Other clarity ratings, in descending order, are WS1, ws2, VS1, and vS2. WS is the notation for "very, very slightly imperfect" and VS is shorthand for "very slightly imperfect." Compare the prices of diamonds based on their darity. Follow the instructions (shown in italics) and use the tool to make a comparative box plot of the prices of the diamonds in the sample based on their danity rating. 1. Click on one of the Correlation sliding panels on the left bottom side of the tool. Select Clarity in the dropdown menu for Dependent Variable, and select Price in the dropdown menu for Independent Variable, ws1 2. Click on the Box Plots button. Horizontal box plots of the diamond prices wil be dis ys1 each clarity rating as well as a box plot of the full data set. ws2 Use your comparative box plot to answer the questions that follow IF The diamond with the overall highest price of any in the data set has the clarity rating The group of diamonds with the highest median price has the clarity rating Based on interquartile range, the group of diamonds with the least price variation has the danty rating Grade It Now Save & Continue Coedi 9. Comparative box plots Most consumers are not diamond experts, so they rely on an independent certification body to determine a diamond's value. Diamonds are assessed on four characteristics, referred to as the "four Cs": carat weight, color, dlarity, and cut. Several certification bodies issue diamond grading reports, including the Gemological Institute of America (GIA), the Hoge Raad voor Diamant (HRD), and the International Gemological Institute (IGI). The Diamonds data set in the following DataView tool contains data on the carat weight, color, clarity, certification body, and selling price of a random sample of 308 round-cut diamond stones. [Source: Chu, Singfat. (2001). "Pricing the C's of Diamond Stones," Journal of Statistics Education Data Archive, 9(2).] Data Set piamonds Sample variables 5 Observations308 Pricing the C's of Diamond Stones Singfat Chu, Journal of Statistks Education Data Archive observations variables Variable Type values Missing Form Observations weight Quantitative qualitative Humeric 308 Color Nonnumeric 308 clarity certification Body Qualitative Honnumeric Qualitathe Nonnumeric Price Quantitathve Humeria variable variable variable variable Correlation Correlation ch hp rlabde Corelation Correlation Clarity is a desirable characteristic of a diamond. The top darity rating is IF (internally flawless), Other clarity ratings, in descending order, are WS1, ws2, VS1, and vS2. WS is the notation for "very, very slightly imperfect" and VS is shorthand for "very slightly imperfect." Compare the prices of diamonds based on their darity. Follow the instructions (shown in italics) and use the tool to make a comparative box plot of the prices of the diamonds in the sample based on their danity rating. 1. Click on one of the Correlation sliding panels on the left bottom side of the tool. Select Clarity in the dropdown menu for Dependent Variable, and select Price in the dropdown menu for Independent Variable, ws1 2. Click on the Box Plots button. Horizontal box plots of the diamond prices wil be dis ys1 each clarity rating as well as a box plot of the full data set. ws2 Use your comparative box plot to answer the questions that follow IF The diamond with the overall highest price of any in the data set has the clarity rating The group of diamonds with the highest median price has the clarity rating Based on interquartile range, the group of diamonds with the least price variation has the danty rating Grade It Now Save & Continue Coedi


