Answered step by step
Verified Expert Solution
Question
1 Approved Answer
9. Equations 4.3 and 4.4 relate the scalar orientational order parameter S for a liquid crystal to the molecular orientational distribution function P(,). (a) Show
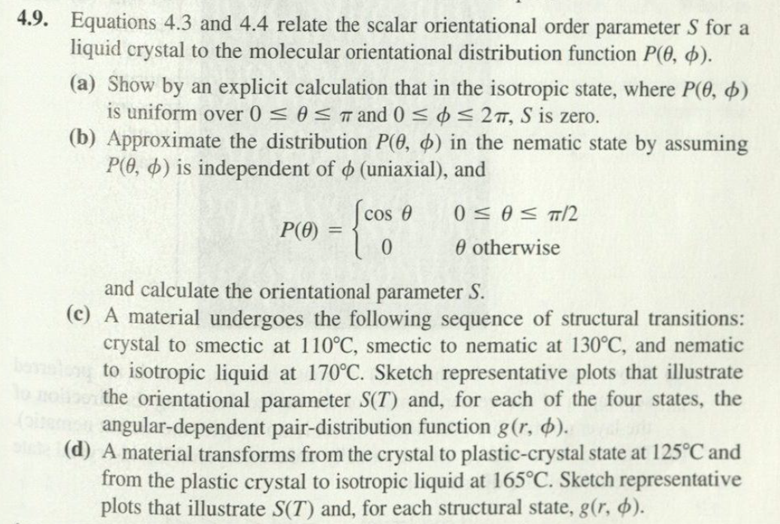
9. Equations 4.3 and 4.4 relate the scalar orientational order parameter S for a liquid crystal to the molecular orientational distribution function P(,). (a) Show by an explicit calculation that in the isotropic state, where P(,) is uniform over 0 and 02,S is zero. (b) Approximate the distribution P(,) in the nematic state by assuming P(,) is independent of (uniaxial), and P()={cos00/2otherwise and calculate the orientational parameter S. (c) A material undergoes the following sequence of structural transitions: crystal to smectic at 110C, smectic to nematic at 130C, and nematic to isotropic liquid at 170C. Sketch representative plots that illustrate the orientational parameter S(T) and, for each of the four states, the angular-dependent pair-distribution function g(r,). (d) A material transforms from the crystal to plastic-crystal state at 125C and from the plastic crystal to isotropic liquid at 165C. Sketch representative plots that illustrate S(T) and, for each structural state, g(r,). 9. Equations 4.3 and 4.4 relate the scalar orientational order parameter S for a liquid crystal to the molecular orientational distribution function P(,). (a) Show by an explicit calculation that in the isotropic state, where P(,) is uniform over 0 and 02,S is zero. (b) Approximate the distribution P(,) in the nematic state by assuming P(,) is independent of (uniaxial), and P()={cos00/2otherwise and calculate the orientational parameter S. (c) A material undergoes the following sequence of structural transitions: crystal to smectic at 110C, smectic to nematic at 130C, and nematic to isotropic liquid at 170C. Sketch representative plots that illustrate the orientational parameter S(T) and, for each of the four states, the angular-dependent pair-distribution function g(r,). (d) A material transforms from the crystal to plastic-crystal state at 125C and from the plastic crystal to isotropic liquid at 165C. Sketch representative plots that illustrate S(T) and, for each structural state, g(r,)
Step by Step Solution
There are 3 Steps involved in it
Step: 1
Get Instant Access to Expert-Tailored Solutions
See step-by-step solutions with expert insights and AI powered tools for academic success
Step: 2
Step: 3
Ace Your Homework with AI
Get the answers you need in no time with our AI-driven, step-by-step assistance
Get Started