Answered step by step
Verified Expert Solution
Question
1 Approved Answer
9 Hint for the portoflio standard deviation, start by creating a table like the one in Section 0 25.1 for the N-asset case. In


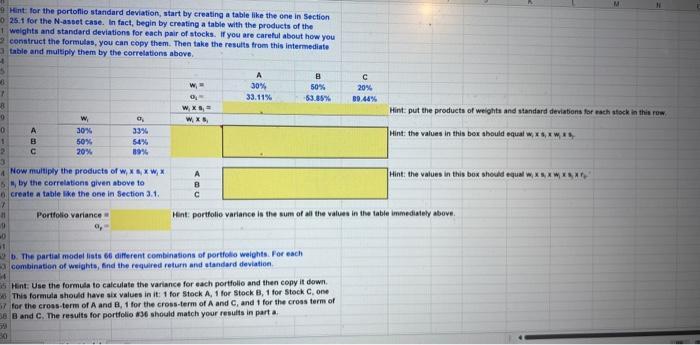
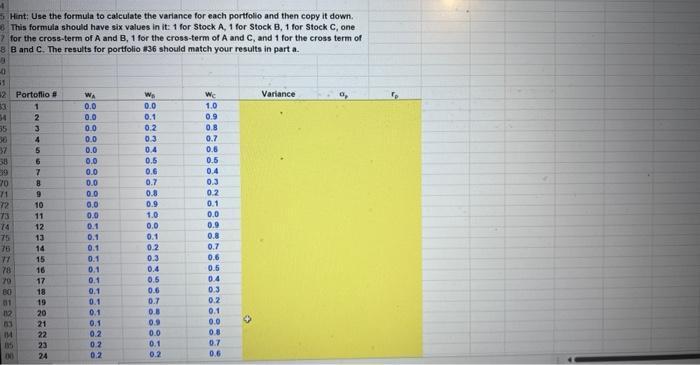
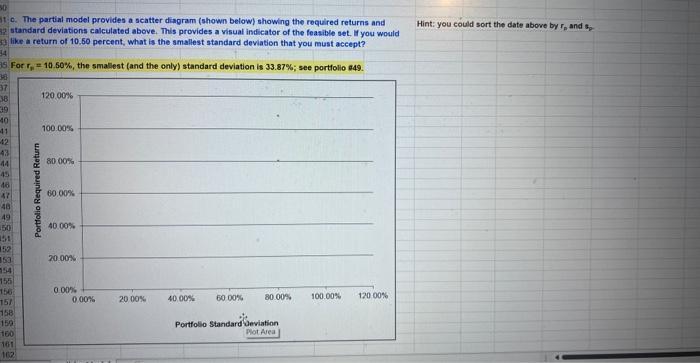
9 Hint for the portoflio standard deviation, start by creating a table like the one in Section 0 25.1 for the N-asset case. In fact, begin by creating a table with the products of the 1 weights and standard deviations for each pair of stocks. If you are careful about how you construct the formulas, you can copy them. Then take the results from this intermediate. table and multiply them by the correlations above. 4 5 6 7 -8 9 0 1 2 A 400 11 19 -0 1 W 30% 50% 20% 3 4 Now multiply the products of w, x, xw, x 5, by the correlations given above to 6 create a table like the one in Section 3.1. 7 0 33% 54% 89% Portfolio variance W, = 0, W, xs, W, XS, A B A 30% 33.11% B 50% 63.85% b. The partial model lists 66 different combinations of portfolio weights. For each 3 combination of weights, find the required return and standard deviation C 20% 89.44% 4 35 Hint: Use the formula to calculate the variance for each portfolio and then copy it down. 56 This formula should have six values in it: 1 for Stock A, 1 for Stock B, 1 for Stock C, one 57 for the cross-term of A and B, 1 for the cross-term of A and C, and 1 for the cross term of 58 B and C. The results for portfolio #36 should match your results in part a 30 Hint: put the products of weights and standard deviations for each stock in this row Hint: the values in this box should equal w, xs, x *** Hint: portfolio variance is the sum of all the values in the table immediately above. Hint: the values in this box should equal w, xs, x MERA 4 5 Hint: Use the formula to calculate the variance for each portfolio and then copy it down. 6 This formula should have six values in it: 1 for Stock A, 1 for Stock B, 1 for Stock C, one 7 for the cross-term of A and B, 1 for the cross-term of A and C, and 1 for the cross term of 8 B and C. The results for portfolio #36 should match your results in part a. 9 -0 31 2 Portoflio # 33: 34 35 36 37 58 09 70 71 72 73 14 75 76 77 78 79 80 01 112 83 IM 1 2 3 4 5 6 7 8 9 10 11 12 PASSERERANAN 13 14 15 16 17 18 19 20 21 22 23 24 WA 0.0 0.0 0.0 0.0 0.0 0.0 0.0 0.0 0.0 0.0 0.0 0.1 0.1 0.1 0.1 0.1 0.1 0.1 0.1 0.1 0.1 0.2 0.2 0.2 W 0.0 0.1 0.2 0.3 ooooooo 34567 0.4 0.5 0.6 0.7 0.8 0.9 1.0 0.0 0.1 0.2 0.3 0.4 0.5 0.6 0.7 0.8 0.9 0.0 0.1 0.2 Wc 1.0 0.9 0.8 0.7 0.6 0.5 0.4 0.3 0.2 0.1 0.0 0.9 0.8 0.7 0.6 0.5 0.4 0.3 0.2 0.1 0.0 0.8 0.7 0.6 O Variance 30 tc. The partial model provides a scatter diagram (shown below) showing the required returns and 82 standard deviations calculated above. This provides a visual indicator of the feasible set. If you would 53 like a return of 10.50 percent, what is the smallest standard deviation that you must accept? 34 35 For r, 10.50%, the smallest (and the only) standard deviation is 33.87% ; see portfolio #49. 38 37 38 39 40 -41 -42 43 44 45 46 AT 48 49 50 154 152 153 154 155 156 157 158 159 160 161 162 Portfolio Required Return 120.00% 100.00% 80.00% 60.00% 40.00% 20.00% 0.00% 0.00% 20.00% 40.00% 60.00% 80.00% Portfolio Standard deviation Plot Area 100.00% 120.00% Hint: you could sort the date above by r, and s
Step by Step Solution
★★★★★
3.33 Rating (159 Votes )
There are 3 Steps involved in it
Step: 1
Answer a Expected Return WA Return A WB Return B WC Return C Expected Return Portfolio Weight W Ret...
Get Instant Access to Expert-Tailored Solutions
See step-by-step solutions with expert insights and AI powered tools for academic success
Step: 2

Step: 3

Ace Your Homework with AI
Get the answers you need in no time with our AI-driven, step-by-step assistance
Get Started


