

Answered step by step
Verified Expert Solution
Question
1 Approved Answer
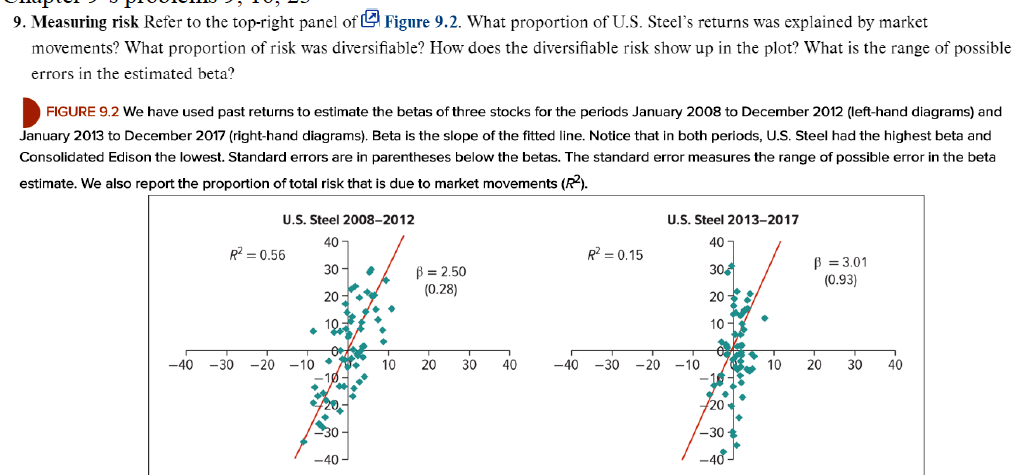
9. Measuring risk Refer to the top-right panel of Figure 9.2. What proportion of U.S. Steel's returns was explained by market movements? What proportion of
Step by Step Solution
There are 3 Steps involved in it
Step: 1

Get Instant Access to Expert-Tailored Solutions
See step-by-step solutions with expert insights and AI powered tools for academic success
Step: 2

Step: 3
Ace Your Homework with AI
Get the answers you need in no time with our AI-driven, step-by-step assistance
Get Started
The Legal Environment Today Summarized Case Edition
Authors: Roger LeRoy Miller
8th Edition
130526276X, 978-1305279407, 1305279409, 978-1305704930, 1305704932, 978-1305262768