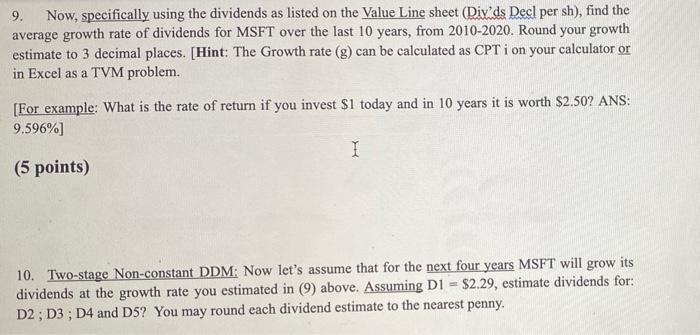
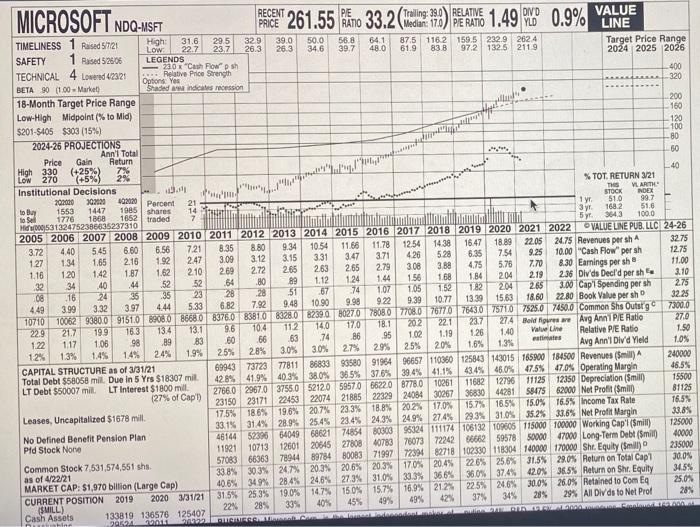
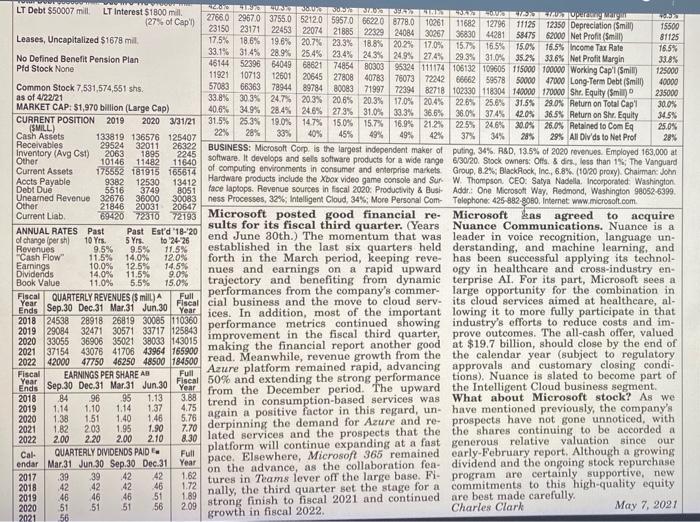
9. Now, specifically using the dividends as listed on the Value Line sheet (Div ds Decl per sh), find the average growth rate of dividends for MSFT over the last 10 years, from 2010-2020. Round your growth estimate to 3 decimal places. (Hint: The Growth rate (g) can be calculated as CPT i on your calculator or in Excel as a TVM problem. [For example: What is the rate of return if you invest $1 today and in 10 years it is worth $2.50? ANS: 9.596%] I (5 points) 10. Two-stage Non-constant DDM: Now let's assume that for the next four years MSFT will grow its dividends at the growth rate you estimated in (9) above. Assuming D1 = $2.29, estimate dividends for: D2, D3, D4 and D5? You may round each dividend estimate to the nearest penny. MICROSOFT NDQ-MSFT 1.49 0.9% . $ 888888 88 Return . Thes STOCK 020 Percent 1985 shares 1652 traded 21 14 7 INDEX 99.7 51.6 100.0 10.54 16.47 6.80 PE 39.0 RELATIVE DIVD VALUE PRICE YLD LINE TIMELINESS 1 Rased 5/721 High 31.6 29.5 329 39.0 50.0 56.8 641 Low 87.5 116 2 159.5 232.9 2624 22.7 23,7 26.3 26.3 346 39.7 48.0 61.9 SAFETY Target Price Range 83 B 1 Resed 528.06 972 1325 2119 LEGENDS 2024 2025 2026 TECHNICAL 4 Lowered 423121 220 x "Cash Fowsh Options Yes Relative Price Strength 400 BETA 90 (1.00 - Market Shaded indicates recession 320 18-Month Target Price Range Low-High Midpoint (% to Mid) $201-$405 $303 (15%) 2024-26 PROJECTIONS Ann'i Total Price Gain High 330 (+25%) LOW 270 (+5%) Institutional Decisions % TOT. RETURN 3/21 ../"Wieluw/www.eu VLAR 207.000 302020 to Buy 1553 1447 1 yr 51.0 to sell 1776 1868 3 yr 1682 Hid/000531324752386635237310 5 y 3643 2005 2006 2007 2008 2009 2010 2011 2012 2013 2014 2015 2016 2017 2018 2019 2020 2021 2022 VALUE LINE PUB, LLC 24-26 3.72 4.40 5.45 6.56 7.21 8.35 8.80 9.34 11.66 11.78 1254 1438 18.89 22.05 24.75 Revenues por sh 32.75 127 134 1.65 2.16 1.92 247 3.09 3.12 3.15 3.31 3.47 3.71 426 528 6.35 7.54 9.25 10.00 "Cash Flow" per sh 12.75 1.16 120 1.42 1.87 1.62 210 269 265 2.63 265 2.79 3.08 3.88 4.75 5.78 7.70 8.30 Earnings per sh 11.00 32 34 .40 ,44 52 52 .64 .80 89 1.12 1.24 1.44 1.56 1.68 1.84 204 2.19 2.36 Divds Decl'd per sh 3.10 08 16 24 35 135 23 28 28 51 67 .74 1.07 105 152 1.82 204 265 3.00 Cap' Spending per sh 275 4.49 3.99 3.32 3.97 4.44 5.33 6.82 7.92 9.48 10.90 9.90 922 9.39 10.77 13.39 15.63 18.60 22.80 Book Value per sho 32.25 10710 100629380091510 BOSO866808376.0838108328.08239.090270780807708.0767707643075710 7525.0 7450.0 Common Shs Outstg7300.0 22.9 21.7 199 16.3 134 13.1 9.6 104 11:2 140 170 18.1 202 23.7 274 Bold fires are Avg Anni P/E Ratio 27.0 1.17 1.08 1.22 98 89 83 Value Line .60 66 .74 63 86 95 1.02 1.19 1.26 1.40 Relative PE Ratio 1.50 estimates 1.3% 1.4% 12% 24% 1.9% 25% 14% 28% 3.0% 30% 27% 29% 1.6% 2.5% 1.3% 20% 1.0% Avg Ann'l Divd Yield CAPITAL STRUCTURE as of 3/31/21 69943 73723 77811 86833 9358091964 96657110360125843 143015 165900 184500 Revenues (Sill) 240000 Total Debt $58058 mil. Due in 5 Yrs $18307 mil. 428% 41,9% 40.3% 38.0% 36.5% 37.6% 39.4% 41.1% 43.4% 46.0% 47.5% 47.0% Operating Margin 46.5% LT Debt $50007 mit LT Interest $1800 mil 15500 11125 12350 Depreciation (Smil) 2766.0 2967.0 37550 52120 59570 66220 8778.0 10261 11682 12796 (27% of Cap) 23150 23171 22453 22074 21885 22329 2408430267 36830 44281 81125 58475 62000 Net Profit (Smill) 15.7% 16,5% 186% 19,6% 20.7% 23,3% 18.8% 202% 17.0% 16.5% 15.0% 16.5Income Tax Rate 17.5% Leases, Uncapitalized $1678 mill. 38.8% 29.3% 31.0% 35.2% 33.6% Net Profit Margin 33.1% 31.4% 28.9% 25.4% 23.4% 24.3% 24.9% 274% 125000 No Defined Benefit Pension Plan 46144 52396 64049 6862174854 8030396324111174106132 109605 115000 100000 Working Cap'l (Smill) Pid Stock None 40000 11921 10713 12601 20645 27808 40783 76073 7224266662 59578 50000 47000 Long-Term Debt (smill 235000 Common Stock 7,531,574,551 shs. 57083 66363 78044 89784 80083 71997 72394 82718 102330 118304 140000 170000 Shr. Equity (Smil) 30.09 2265 25.6% 31.5% 29.0% Return on Total Capi 33.8% 303% 247% 20.3% 20.6% 20.3% 17.0% 20.4% as of 4/22/21 34.5% 38.0% 374% 42.0% 36.5% Return on Shr. Equity 40.6% 349%284% 24,6% 27.3% 31.0% 33.3% 36.6% MARKET CAP: $1,970 billion (Large Cap) 25.0% 30.0% 26.0% Retained to Com Eq 2020 33121 31.5% 253% 19.0% CURRENT POSITION 2019 14.7 15.0% 15.7% 16.9% 212% 22.5% 20.6% SMILL) 33% 40% 22 45% 49% 28% 28% 34% 49% 29% All Divds to Net Prof 285 42% 37% Cash Assets 133819 136576 125407 PRETOVAR POR WALI PRIORIT 272 221 WORRAS Shin 22 2010 15500 81125 16.5% 33.8% 125000 40000 No Defined Benefit Pension Plan Pid Stock None as of 4/22/21 30.0% 34.5% 25.0% 28% 28% 49% 42% 37% 20% 2063 10146 1895 11482 Current Assets 12530 8051 30083 20647 21846 20031 5 Yrs. to 24-26 11.5% 12.0% LT Debt $50007 mill LT Interest $1800 mil HUNYORUZ WY TOUS 27660 29670 3755.0 52120 59570 66220 8778.0 10261 11682 12796 11125 KES percury (27% of Cap 2315023171 12350 Depreciation (Smil 22453 22074 21885 22329 24084 30267 36830 44281 58475 62000 Net Profit (Smill) Leases, Uncapitalized $1678 mil 17.5% 18.6% 19.6% 20.7% 23,3% 18.8% 20.2 17.0% 15.7% 16,5% 15.0% 16.5% Income Tax Rate 33.1% 31.4% 28.9% 25.4% 23.4% 243% 249% 27.4% 29.3% 31.0% 35.2% 33.6% Net Profit Margin 46144 52396 64049 68621 74854 80303 95324 111174 106132109605 115000 100000 Working Cap' (Smill) 11921 10713 12601 20645 27808 40783 76073 72242 66662 59578 50000 47000 Long-Term Debt (Smill) Common Stock 7,531,574,551 shs. 57083 66363 789448978480083 71997 72394 82718 102330 118304 140000 170000 Shr. Equity($mill 235000 33.8% 30.3% 24.7% 203% 20.6% 20.3% 17.0% 20.4% MARKET CAP: $1,970 billion (Large Cap) 226 25.6% 31.5% 29.0% Return on Total Cap' 40.6% 34.9% 28.4% 246% 273% 31.0% 33.3% 36.6% 36.0% 374% 42.0% 36.5% Return on Shr. Equity CURRENT POSITION 2019 20203/31/21 31.5% 25.3% 19.0% 14.7% 15.0% 15.7% 16.9% 21.2% 225 24.6% 30.0% 26.0% Retained to Com Eq (SMILL) Cash Assets 22% 33% 40% 45% 133819 136576 125407 49% 34% 29% All Divds to Net Prof Receivables 29524 32011 26322 BUSINESS: Microsoft Corp. is the largest independent maker of puting, 34% R&D, 13.5% of 2020 revenues. Employed 163,000 at Inventory (Avg Cst) 2245 Other software. It develops and sells software products for a wide range 6/30/20. Stock owners: Offs & dirs, less than 1%; The Vanguard 11640 175652 181915 165614 of computing environments in consumer and enterprise markets Group, 8.2%; Black Rock, Inc., 6.8% (10/20 proxy) Chairman John Accts Payable Hardware products include the Xbox video game console and Sur W. Thompson, CEO: Satya Nadella. Incorporated Washington 9382 13412 Debt Due 5516 3749 face laptops. Revenue sources in fiscal 2020: Productivity & Bust Addr: One Microsoft Way. Redmond, Washington 980526399 Unearned Revenue 32676 36000 ness Processes, 32% Intelligent Cloud, 34%; More Personal Com Telephone: 425-882-8080, Internet www.microsoft.com Other Current Lab 89420 72370 72193 Microsoft posted good financial re- Microsoft kas agreed to acquire sults for its fiscal third quarter. (Years Nuance Communications. Nuance is a ANNUAL RATES Past Past Estd 10:20 end June 30th.) The momentum that was leader in voice recognition, language un of change (per shi 10 Yrs. Revenues 9.5% 9.5% established in the last six quarters held derstanding, and machine learning, and "Cash Flow 11.5% 14.0% forth in the March period, keeping reve has been successful applying its technol- Earnings 10.0% 14.5% Dividends 14.0% 11.5% 9.0% nues and earnings on a rapid upward ogy in healthcare and cross-industry en- 15.0% trajectory and benefiting from dynamic terprise Al. For its part, Microsoft sees a Fiscal QUARTERLY REVENUES($mill) performances from the company's commer- large opportunity for the combination in Bear Sep.30 Dec.31 Mar 31 Jun 30 local cial business and the move to cloud sery. its cloud services aimed at healthcare, al- ices. In addition, most of the important lowing it to more fully participate in that 2018 24588 28918 26879 30085110369 performance metrics continued showing industry's offorts to reduce costs and im 2020 33056 36906 35021 38033 143015 improvement in the fiscal third quarter, prove outcomes. The all-cash offer, valued 2021 37154 43076 41706 43964 165900 making the financial report another good at $19.7 billion, should close by the end of 2022 42000 47750 46250 48500 184500 read. Meanwhile, revenue growth from the the calendar year (subject to regulatory Azure platform remained rapid, advancing approvals and customary closing condi- Fiscal EARNINGS PER SHARE AB Encor Sep.30 Dec.31 Mar 31 Jun.30 Focal 50% and extending the strong performance tions). Nuance is slated to become part of Year from the December period. The upward the Intelligent Cloud business segment. 2018 B4 196 What about Microsoft stock? As we trend in consumption-based services was 1.10 again a positive factor in this regard, un- have mentioned previously, the company's 1.46 1.90 7.70 derpinning the demand for Azure and re- prospects have not gone unnoticed, with 2.00 2.20 2.10 8.30 lated services and the prospects that the the shares continuing to be accorded a QUARTERLY DIVIDENDS PAID platform will continue expanding at a fost generous relative valuation since our endar Mar 31 Jun 30 Sep 30 Dec 31 Vear pace. Elsewhere, Microsoft 365 remained early February report. Although a growing on the advance, as the collaboration fea- dividend and the ongoing stock repurchase 39 tures in Teams lever off the large base. Fl- program are certainly supportive, new 1.72 nally, the third quarter set the stage for a commitments to this high-quality equity 2020 51 209 strong finish to fiscal 2021 and continued are best made carefully, 56 Charles Clark May 7, 2021 growth in fiscal 2022. 2021 56 12.5% Book Value 11.0% 5.5% Full Full 1.13 1.37 1.14 1.38 1.82 3.88 4.75 5.76 2019 2020 2021 2022 1.51 95 1.14 1.40 1.95 2.00 203 Cal 1.62 2017 2018 2019 39 42 .46 42 46 51 .42 42 46 51 42 46 51 1.89


