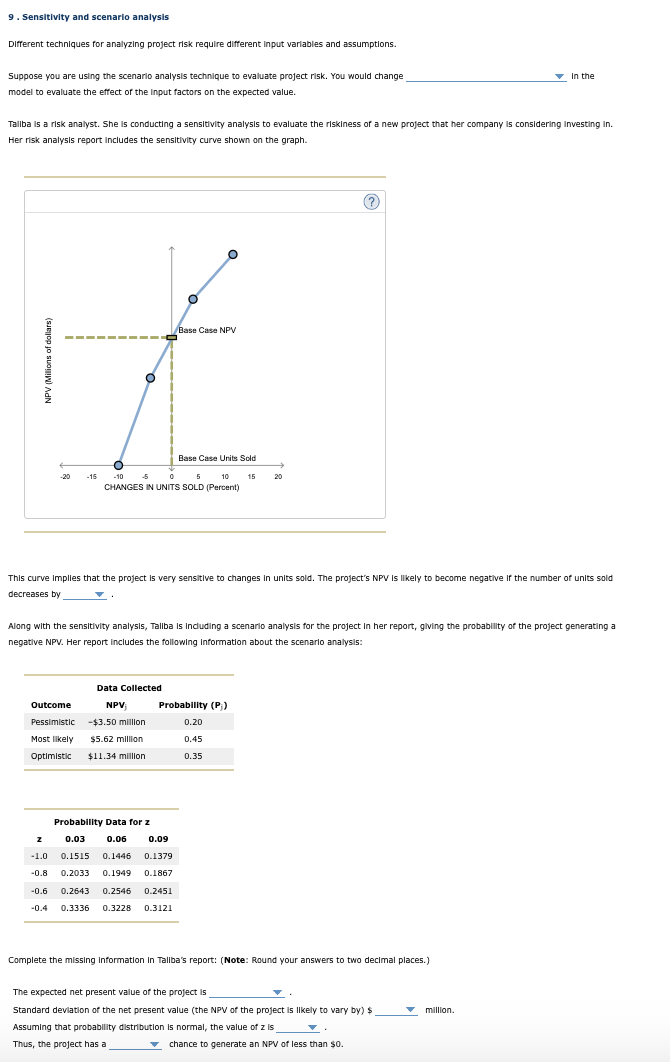
9. Sensitivity and scenario analysis Different techniques for analyzing project risk require different input variables and assumptions. Suppose you are using the scenarlo analysis technique to evaluate project risk. You would change In the model to evaluate the effect of the input factors on the expected value. Tallba is a risk analyst. She ls conducting a sensitivity analysis to evaluate the riskiness of a new project that her company is considering investing in. Her risk analysis report includes the sensitivity curve shown on the graph. This curve implles that the project is very sensitive to changes in units sold. The project's NPv is IIkely to become negative if the number of units sold decreases by Along with the sensitivity analysls, Tallba is Induding a scenario analysis for the project in her report, giving the probability of the project generating a negatlve NPV. Her report includes the following Information about the scenario analysis: Complete the missing Information in Tallba's report: (Note: Round your answers to two decimal places.) The expected net present value of the project 15 Standard deviation of the net present value (the NPV of the project is llkely to vary by) $ million. Assuming that probability distribution is normal, the value of z is Thus, the project has a chance to generate an NPV of less than $0. 9. Sensitivity and scenario analysis Different techniques for analyzing project risk require different input variables and assumptions. Suppose you are using the scenarlo analysis technique to evaluate project risk. You would change In the model to evaluate the effect of the input factors on the expected value. Tallba is a risk analyst. She ls conducting a sensitivity analysis to evaluate the riskiness of a new project that her company is considering investing in. Her risk analysis report includes the sensitivity curve shown on the graph. This curve implles that the project is very sensitive to changes in units sold. The project's NPv is IIkely to become negative if the number of units sold decreases by Along with the sensitivity analysls, Tallba is Induding a scenario analysis for the project in her report, giving the probability of the project generating a negatlve NPV. Her report includes the following Information about the scenario analysis: Complete the missing Information in Tallba's report: (Note: Round your answers to two decimal places.) The expected net present value of the project 15 Standard deviation of the net present value (the NPV of the project is llkely to vary by) $ million. Assuming that probability distribution is normal, the value of z is Thus, the project has a chance to generate an NPV of less than $0