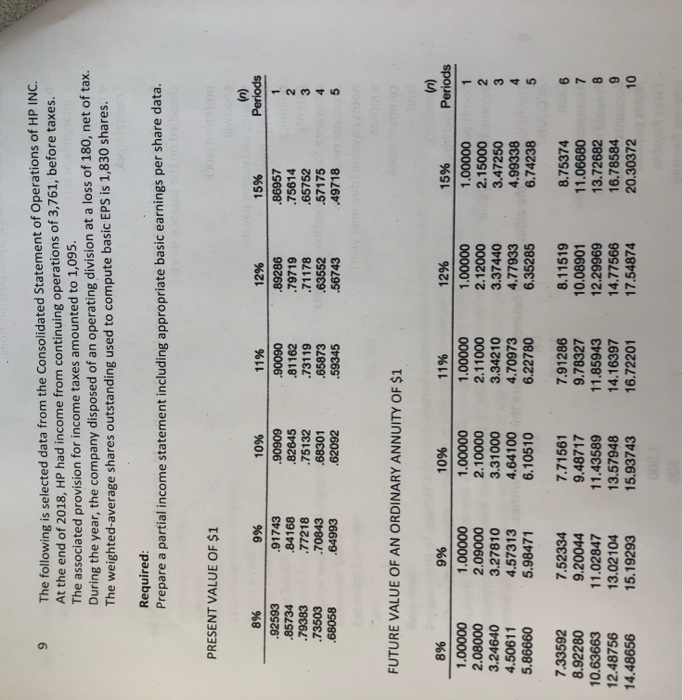
9 The following is selected data from the Consolidated Statement of Operations of HP INC. At the end of 2018, HP had income from continuing operations of 3,761, before taxes. The associated provision for income taxes amounted to 1,095. During the year, the company disposed of an operating division at a loss of 180, net of tax. The weighted average shares outstanding used to compute basic EPS is 1,830 shares. Required: Prepare a partial income statement including appropriate basic earnings per share data. PRESENT VALUE OF $1 (n) Periods 8% .92593 .85734 .79383 .73503 .68058 9% .91743 .84168 .77218 .70843 .64993 10% .90909 .82645 .75132 .68301 .62092 11% .90090 .81162 .73119 .65873 .59345 12% .89286 .79719 .71178 .63552 .56743 15% .86957 .75614 .65752 .57175 .49718 4 FUTURE VALUE OF AN ORDINARY ANNUITY OF $1 8% : 9% Periods 1.00000 2.08000 3.24640 4.50611 5.86660 1.00000 2.09000 3.27810 4.57313 5.98471 10% 1.00000 2.10000 3.31000 4.64100 6.10510 11% 1.00000 2.11000 3.34210 4.70973 6.22780 12% 1.00000 2.12000 3.37440 4.77933 6.35285 15% 1.00000 2.15000 3.47250 4.99338 6.74238 7.33592 8.92280 10.63663 12.48756 14.48656 7.52334 9.20044 11.02847 13.02104 15.19293 7.71561 9.48717 11.43589 13.57948 15.93743 7.91286 9.78327 11.85943 14.16397 16.72201 8.11519 10.08901 12.29969 14.77566 17.54874 8.75374 11.06680 13.72682 16.78584 20.30372 PRESENT VALUE OF AN ORDINARY ANNUITY OF $1 8% in) Periods .92593 1.78326 2.57710 3.31213 3.99271 9% .91743 1.75911 2.53130 3.23972 3.88965 10% .90909 1.73554 2.48685 3.16986 3.79079 11% .90090 1.71252 2.44371 3.10245 3.69590 12% .89286 1.69005 2.40183 3.03735 3.60478 15% .86957 1.62571 2.28323 2.85498 3.35216 4.62288 5.20637 5.74664 6.24689 6.71008 4.48592 5.03295 5.53482 5.99525 6.41766 4.35526 4.86842 5.33493 5.75902 6.14457 4.23054 4.71220 5.14612 5.53705 5.88923 4.11141 4.56376 4.96764 5.32825 5.65022 3.78448 4.16042 4.48732 4.77158 5.01877 OOO