Answered step by step
Verified Expert Solution
Question
1 Approved Answer
9. The population of Surrey, BC is shown in the table below for the years 1986 through 2011 in five year increments. Surrey incorporated in
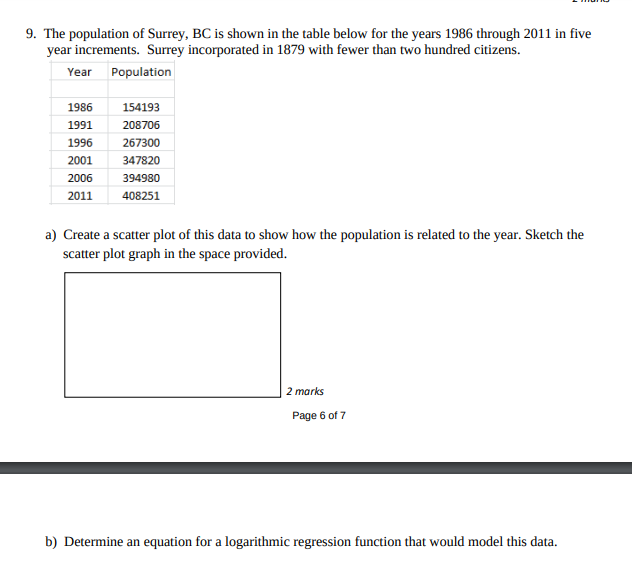
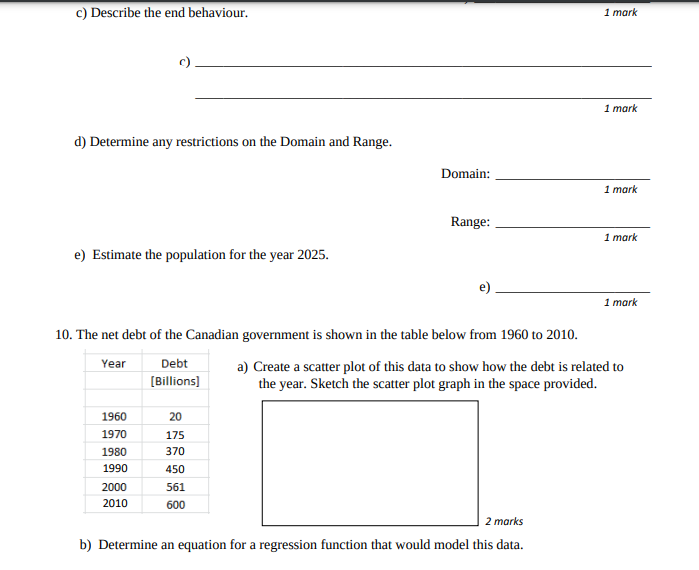
9. The population of Surrey, BC is shown in the table below for the years 1986 through 2011 in five year increments. Surrey incorporated in 1879 with fewer than two hundred citizens. Year Population 1986 154193 1991 208706 1996 267300 2001 347820 2006 394980 2011 408251 a) Create a scatter plot of this data to show how the population is related to the year. Sketch the scatter plot graph in the space provided. 2 marks Page 6 of 7 b) Determine an equation for a logarithmic regression function that would model this data.c} Describe the and behaviour. I writ F} I merit :1} Determine any restrictions on the Domain and Range. Domain: I writ Range: I merit e] Estimate the population for the year 2025. E} I writ id. The net debt of the Canadian government is shown in the table below from 1950 to 2010. rear Debt a} Create a scatter plot of this data to show how the debt is related to [Billions] the year. Sketch the scatter plot graph in the space provided. l 2D 19m 115 193i] 3m 1990 450 lotto 551 2010 am 2 mocks b) Determine an equation for a regression function that would model this data. DJ 1 mark c) In what year will the year the debt will go over 800 billion dollars? C) 1 mark Page 7 of 7
Step by Step Solution
There are 3 Steps involved in it
Step: 1
Get Instant Access to Expert-Tailored Solutions
See step-by-step solutions with expert insights and AI powered tools for academic success
Step: 2
Step: 3
Ace Your Homework with AI
Get the answers you need in no time with our AI-driven, step-by-step assistance
Get Started