Question
9. The relative strengths of 150 silver solder welds are tested, and the results are given in the following table. Tally these figures and


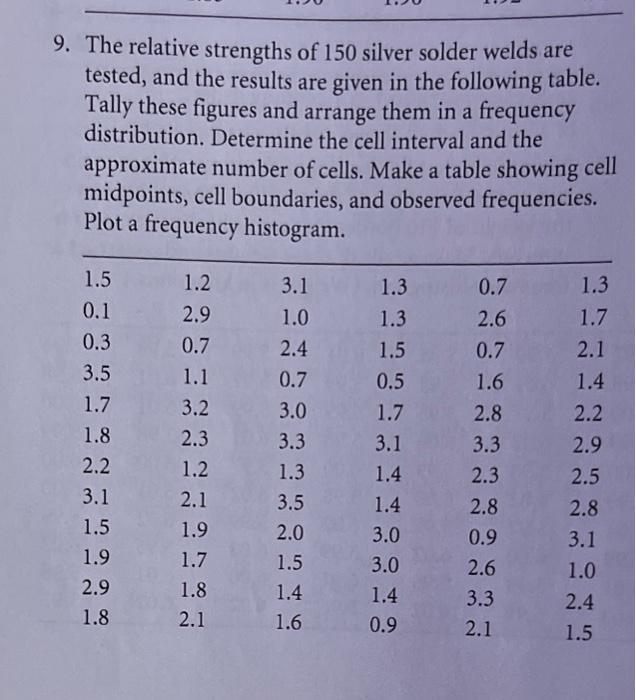
9. The relative strengths of 150 silver solder welds are tested, and the results are given in the following table. Tally these figures and arrange them in a frequency distribution. Determine the cell interval and the approximate number of cells. Make a table showing cell midpoints, cell boundaries, and observed frequencies. Plot a frequency histogram. 1.5 0.1 0.3 3.5 1.7 1.8 2.2 3.1 1.5 1.9 2.9 1.8 1.2 2.9 0.7 1.1 3.2 2.3 1.2 2.1 1.9 1.7 1.8 2.1 3.1 1.3 1.0 1.3 2.4 1.5 0.7 0.5 3.0 1.7 3.3 3.1 1.3 3.5 2.0 1.5 1.4 1.6 1.4 1.4 3.0 3.0 1.4 0.9 0.7 2.6 0.7 1.6 2.8 3.3 2.3 2.8 0.9 2.6 3.3 2.1 1.3 1.7 2.1 1.4 2.2 2.9 2.5 2.8 3.1 1.0 2.4 1.5 13. Using the data of Exercise 9, construct: a. A relative frequency histogram b. A cumulative frequency histogram c. A relative cumulative frequency histogram
Step by Step Solution
3.38 Rating (148 Votes )
There are 3 Steps involved in it
Step: 1

Get Instant Access to Expert-Tailored Solutions
See step-by-step solutions with expert insights and AI powered tools for academic success
Step: 2

Step: 3

Ace Your Homework with AI
Get the answers you need in no time with our AI-driven, step-by-step assistance
Get StartedRecommended Textbook for
Chemistry The Central Science
Authors: Theodore Brown, Eugene LeMay, Bruce Bursten, Catherine Murphy, Patrick Woodward
12th edition
321696727, 978-0132175081, 978-0321696724
Students also viewed these Accounting questions
Question
Answered: 1 week ago
Question
Answered: 1 week ago
Question
Answered: 1 week ago
Question
Answered: 1 week ago
Question
Answered: 1 week ago
Question
Answered: 1 week ago
Question
Answered: 1 week ago
Question
Answered: 1 week ago
Question
Answered: 1 week ago
Question
Answered: 1 week ago
Question
Answered: 1 week ago
Question
Answered: 1 week ago
Question
Answered: 1 week ago
Question
Answered: 1 week ago
Question
Answered: 1 week ago
Question
Answered: 1 week ago
Question
Answered: 1 week ago
Question
Answered: 1 week ago
Question
Answered: 1 week ago
Question
Answered: 1 week ago
Question
Answered: 1 week ago
Question
Answered: 1 week ago
View Answer in SolutionInn App


