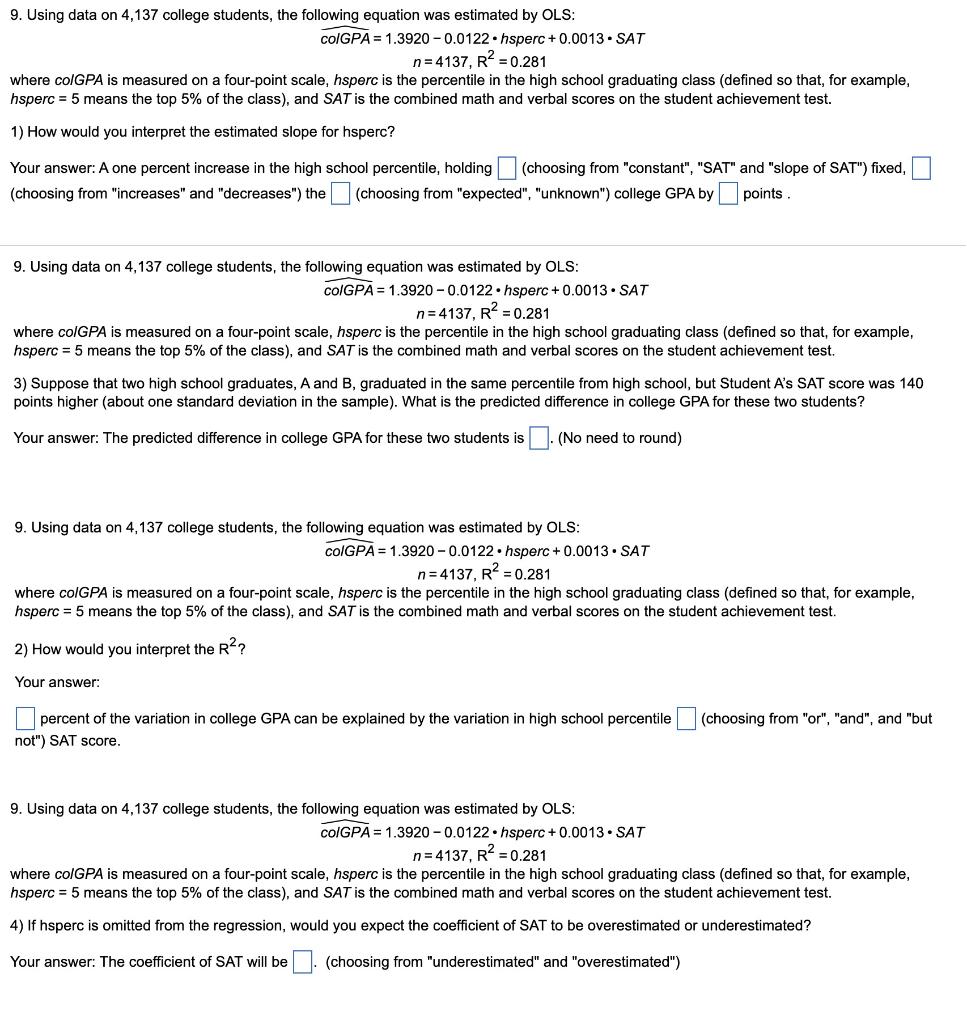
9. Using data on 4,137 college students, the following equation was estimated by OLS: ColGPA=1.39200.0122hsperc+0.0013SATn=4137,R2=0.281 where colGPA is measured on a four-point scale, hsperc is the percentile in the high school graduating class (defined so that, for example, hsperc =5 means the top 5% of the class), and SAT is the combined math and verbal scores on the student achievement test. 1) How would you interpret the estimated slope for hsperc? Your answer: A one percent increase in the high school percentile, holding (choosing from "constant", "SAT" and "slope of SAT") fixed, (choosing from "increases" and "decreases") the (choosing from "expected", "unknown") college GPA by points . 9. Using data on 4,137 college students, the following equation was estimated by OLS: ColGPA=1.39200.0122hsperc+0.0013SATn=4137,R2=0.281 where colGPA is measured on a four-point scale, hsperc is the percentile in the high school graduating class (defined so that, for example, hsperc =5 means the top 5% of the class), and SAT is the combined math and verbal scores on the student achievement test. 3) Suppose that two high school graduates, A and B, graduated in the same percentile from high school, but Student A's SAT score was 140 points higher (about one standard deviation in the sample). What is the predicted difference in college GPA for these two students? Your answer: The predicted difference in college GPA for these two students is . (No need to round) 9. Using data on 4,137 college students, the following equation was estimated by OLS: ColGPA=1.39200.0122hsperc+0.0013SATn=4137,R2=0.281 where colGPA is measured on a four-point scale, hsperc is the percentile in the high school graduating class (defined so that, for example, hsperc =5 means the top 5% of the class), and SAT is the combined math and verbal scores on the student achievement test. 2) How would you interpret the R2 ? Your answer: percent of the variation in college GPA can be explained by the variation in high school percentile (choosing from "or", "and", and "but not") SAT score. 9. Using data on 4,137 college students, the following equation was estimated by OLS: colGPA=1.39200.0122hsperc+0.0013SATn=4137,R2=0.281 where colGPA is measured on a four-point scale, hsperc is the percentile in the high school graduating class (defined so that, for example, hsperc =5 means the top 5% of the class), and SAT is the combined math and verbal scores on the student achievement test. 4) If hsperc is omitted from the regression, would you expect the coefficient of SAT to be overestimated or underestimated? Your answer: The coefficient of SAT will be (choosing from "underestimated" and "overestimated") 9. Using data on 4,137 college students, the following equation was estimated by OLS: ColGPA=1.39200.0122hsperc+0.0013SATn=4137,R2=0.281 where colGPA is measured on a four-point scale, hsperc is the percentile in the high school graduating class (defined so that, for example, hsperc =5 means the top 5% of the class), and SAT is the combined math and verbal scores on the student achievement test. 1) How would you interpret the estimated slope for hsperc? Your answer: A one percent increase in the high school percentile, holding (choosing from "constant", "SAT" and "slope of SAT") fixed, (choosing from "increases" and "decreases") the (choosing from "expected", "unknown") college GPA by points . 9. Using data on 4,137 college students, the following equation was estimated by OLS: ColGPA=1.39200.0122hsperc+0.0013SATn=4137,R2=0.281 where colGPA is measured on a four-point scale, hsperc is the percentile in the high school graduating class (defined so that, for example, hsperc =5 means the top 5% of the class), and SAT is the combined math and verbal scores on the student achievement test. 3) Suppose that two high school graduates, A and B, graduated in the same percentile from high school, but Student A's SAT score was 140 points higher (about one standard deviation in the sample). What is the predicted difference in college GPA for these two students? Your answer: The predicted difference in college GPA for these two students is . (No need to round) 9. Using data on 4,137 college students, the following equation was estimated by OLS: ColGPA=1.39200.0122hsperc+0.0013SATn=4137,R2=0.281 where colGPA is measured on a four-point scale, hsperc is the percentile in the high school graduating class (defined so that, for example, hsperc =5 means the top 5% of the class), and SAT is the combined math and verbal scores on the student achievement test. 2) How would you interpret the R2 ? Your answer: percent of the variation in college GPA can be explained by the variation in high school percentile (choosing from "or", "and", and "but not") SAT score. 9. Using data on 4,137 college students, the following equation was estimated by OLS: colGPA=1.39200.0122hsperc+0.0013SATn=4137,R2=0.281 where colGPA is measured on a four-point scale, hsperc is the percentile in the high school graduating class (defined so that, for example, hsperc =5 means the top 5% of the class), and SAT is the combined math and verbal scores on the student achievement test. 4) If hsperc is omitted from the regression, would you expect the coefficient of SAT to be overestimated or underestimated? Your answer: The coefficient of SAT will be (choosing from "underestimated" and "overestimated")