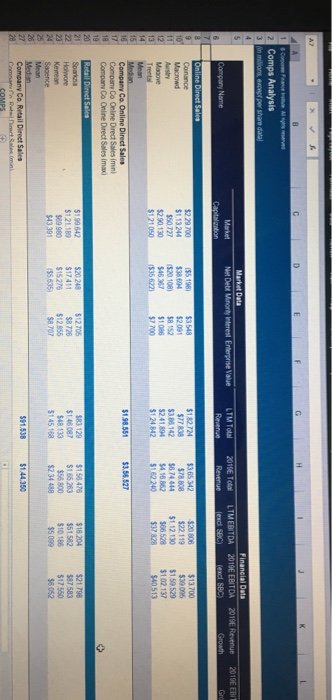
9 What is the mean EV/Revenue multiple in the Online Direct Sales comps group in 2019? 0.8x 1.2x 0.6% 2 Comps Analysis 3 m , per share data) Market Data Net Debt Mirony interest Enterprise Value Market Capitation LTM TOEN Prene 2015 To Revenue Company Name Financial Data 2019E EBITDA (excl SBC LTMEBITDA (end SBC 2019 Revenue Growth 2019E EBIL Gra Online Direct Sales 55.1981 $3.65342 $2.29.700 $1.13244 Macrowd $3.548 $2.091 $8152 (520.1081 $46357 $1827244 $77838 $380.142 5241894 $124.842 $20.800 $22.119 $112130 506 528 $3782 $13700 559.005 $1,59,523 $1.02. 137 $40513 Magove $6.74444 $4.16 862 $62240 $2.90.130 $121050 100 $7700 $198.551 $3.56,527 Median Company Co Online Direct Sales Company Co Online Direct Salesimin Company Co Online Direct Sales imax & NBS Retail Direct Sales Sear $83.129 $150.45 $10.542 $121.189 $69.980 $4339 $20 248 $17411 $15275 155.6351 $12705 58726 $12655 $8/07 $15.204 $51582 $10.1555 $21798 27583 $17.550 96.052 Kemen $48.133 $145 158 $56.800 $2.34.488 $5099 S81.538 $144350 Medan Company Co. Retail Direct Sales Caman a t min COMPS - Market Data Net Debt Minority interest Enterprise Value Company Name 20" Market Capillon $43391 LTM Total Revenue $145,168 2019 Total Revenue $24.41 LTMEBITDA (excl SBC $5099 Financial Data 2019E EBITDA (excl SBCI $6052 2015 Revenue Goth $5635 $8707 Median Company Co. Retail Direct Sales Company Co Retal Drect Salesimin Company Co Real Drect Sales Imax) 8588 Online Marketplace Natiewe Basan $2.79 645 $170 504 5364074 (572001 544 2/ 61 5 7 455 $3880 5 03 $45.642 $1.15.180 $42.45 $86.117 $214 690 80 583 $26.501 $92509 3137 $24.557 $138.755 24.560 Medan Company Co. Online Marketplace Company Co Online Marketplace min) Company Co Online Marketplace (max) S159 Service Package Prowany - Codesk $82317 $29.057 $3.425 $1 24353 $69.094 $83.077 $36.056 S4578 $52674 $24200 $2.983 5 $40.560 23,646 $2.752