Question: 9.1 Testing the Difference between two Proportions. I want you to help me solve this question. it's a 7 part step to the question of
9.1 Testing the Difference between two Proportions. I want you to help me solve this question. it's a 7 part step to the question of answering the 7 questions, the question of help me solve this shows a step by step on how to do it all 7 part, I'm going to attach a photo of the question right below it. I also have a view an example to help on solving the question I will attach it below as well. Make sure to use a chart called negative z score and positive z score.
Here is the question.
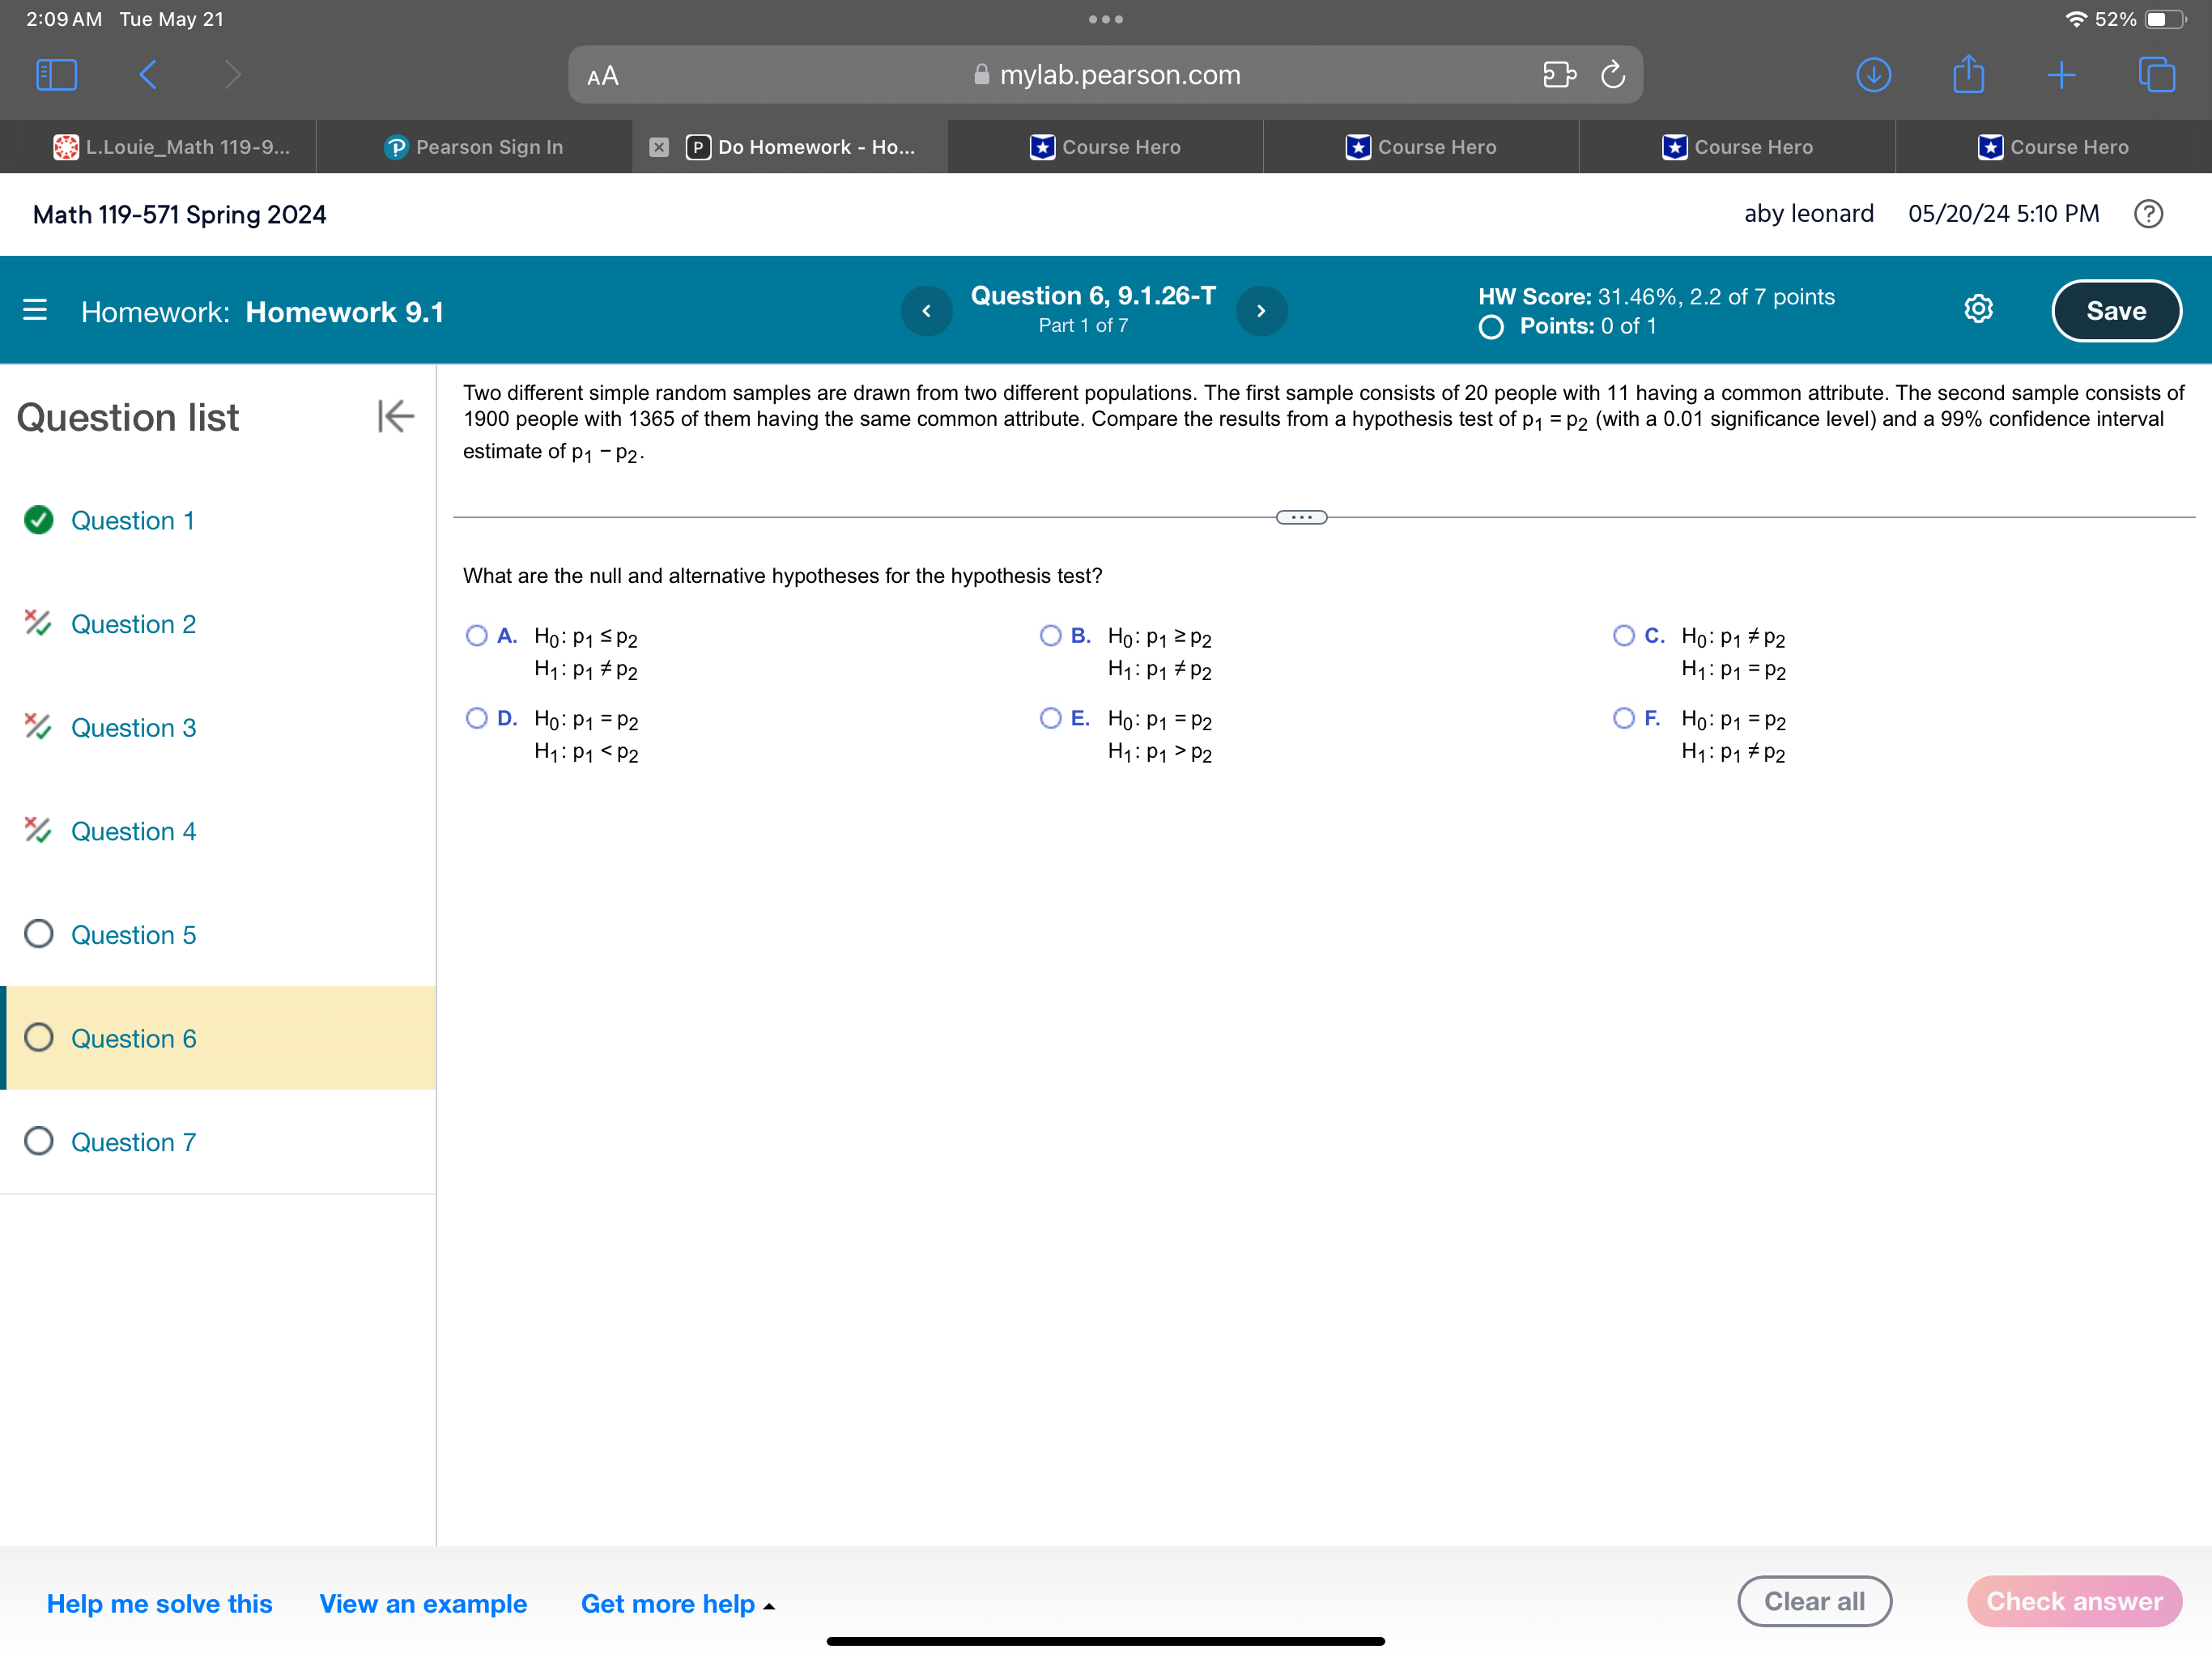
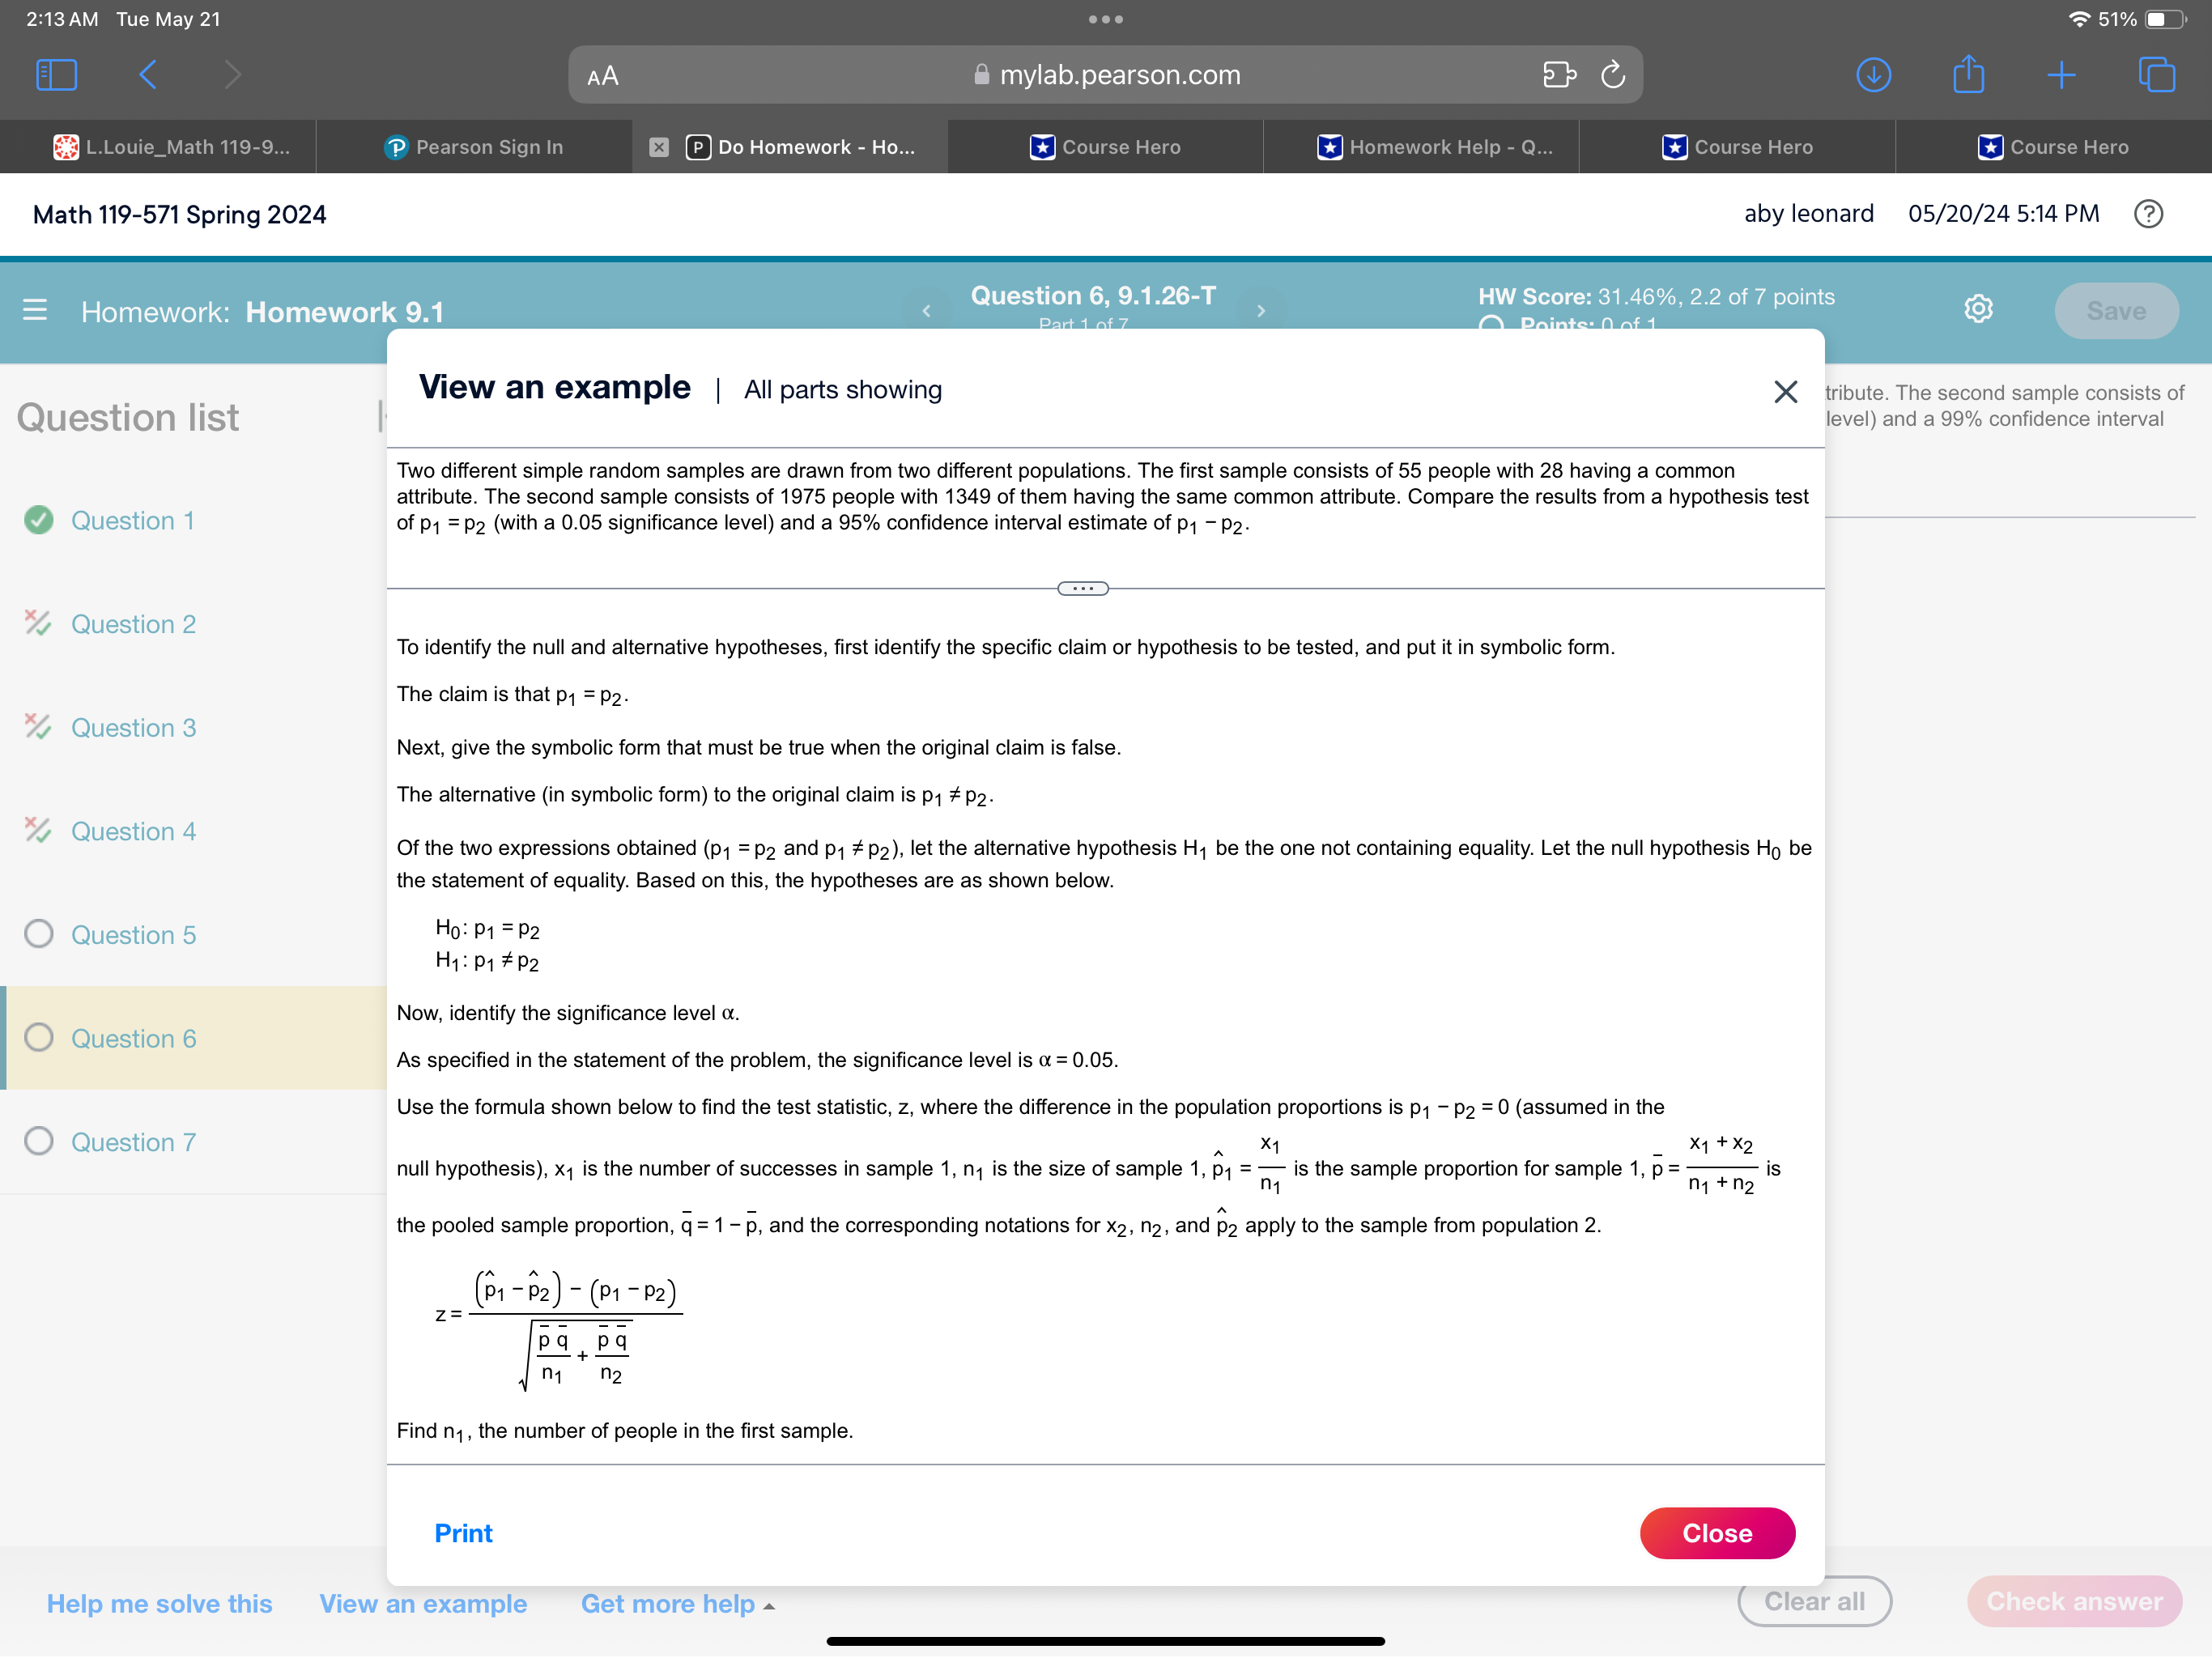
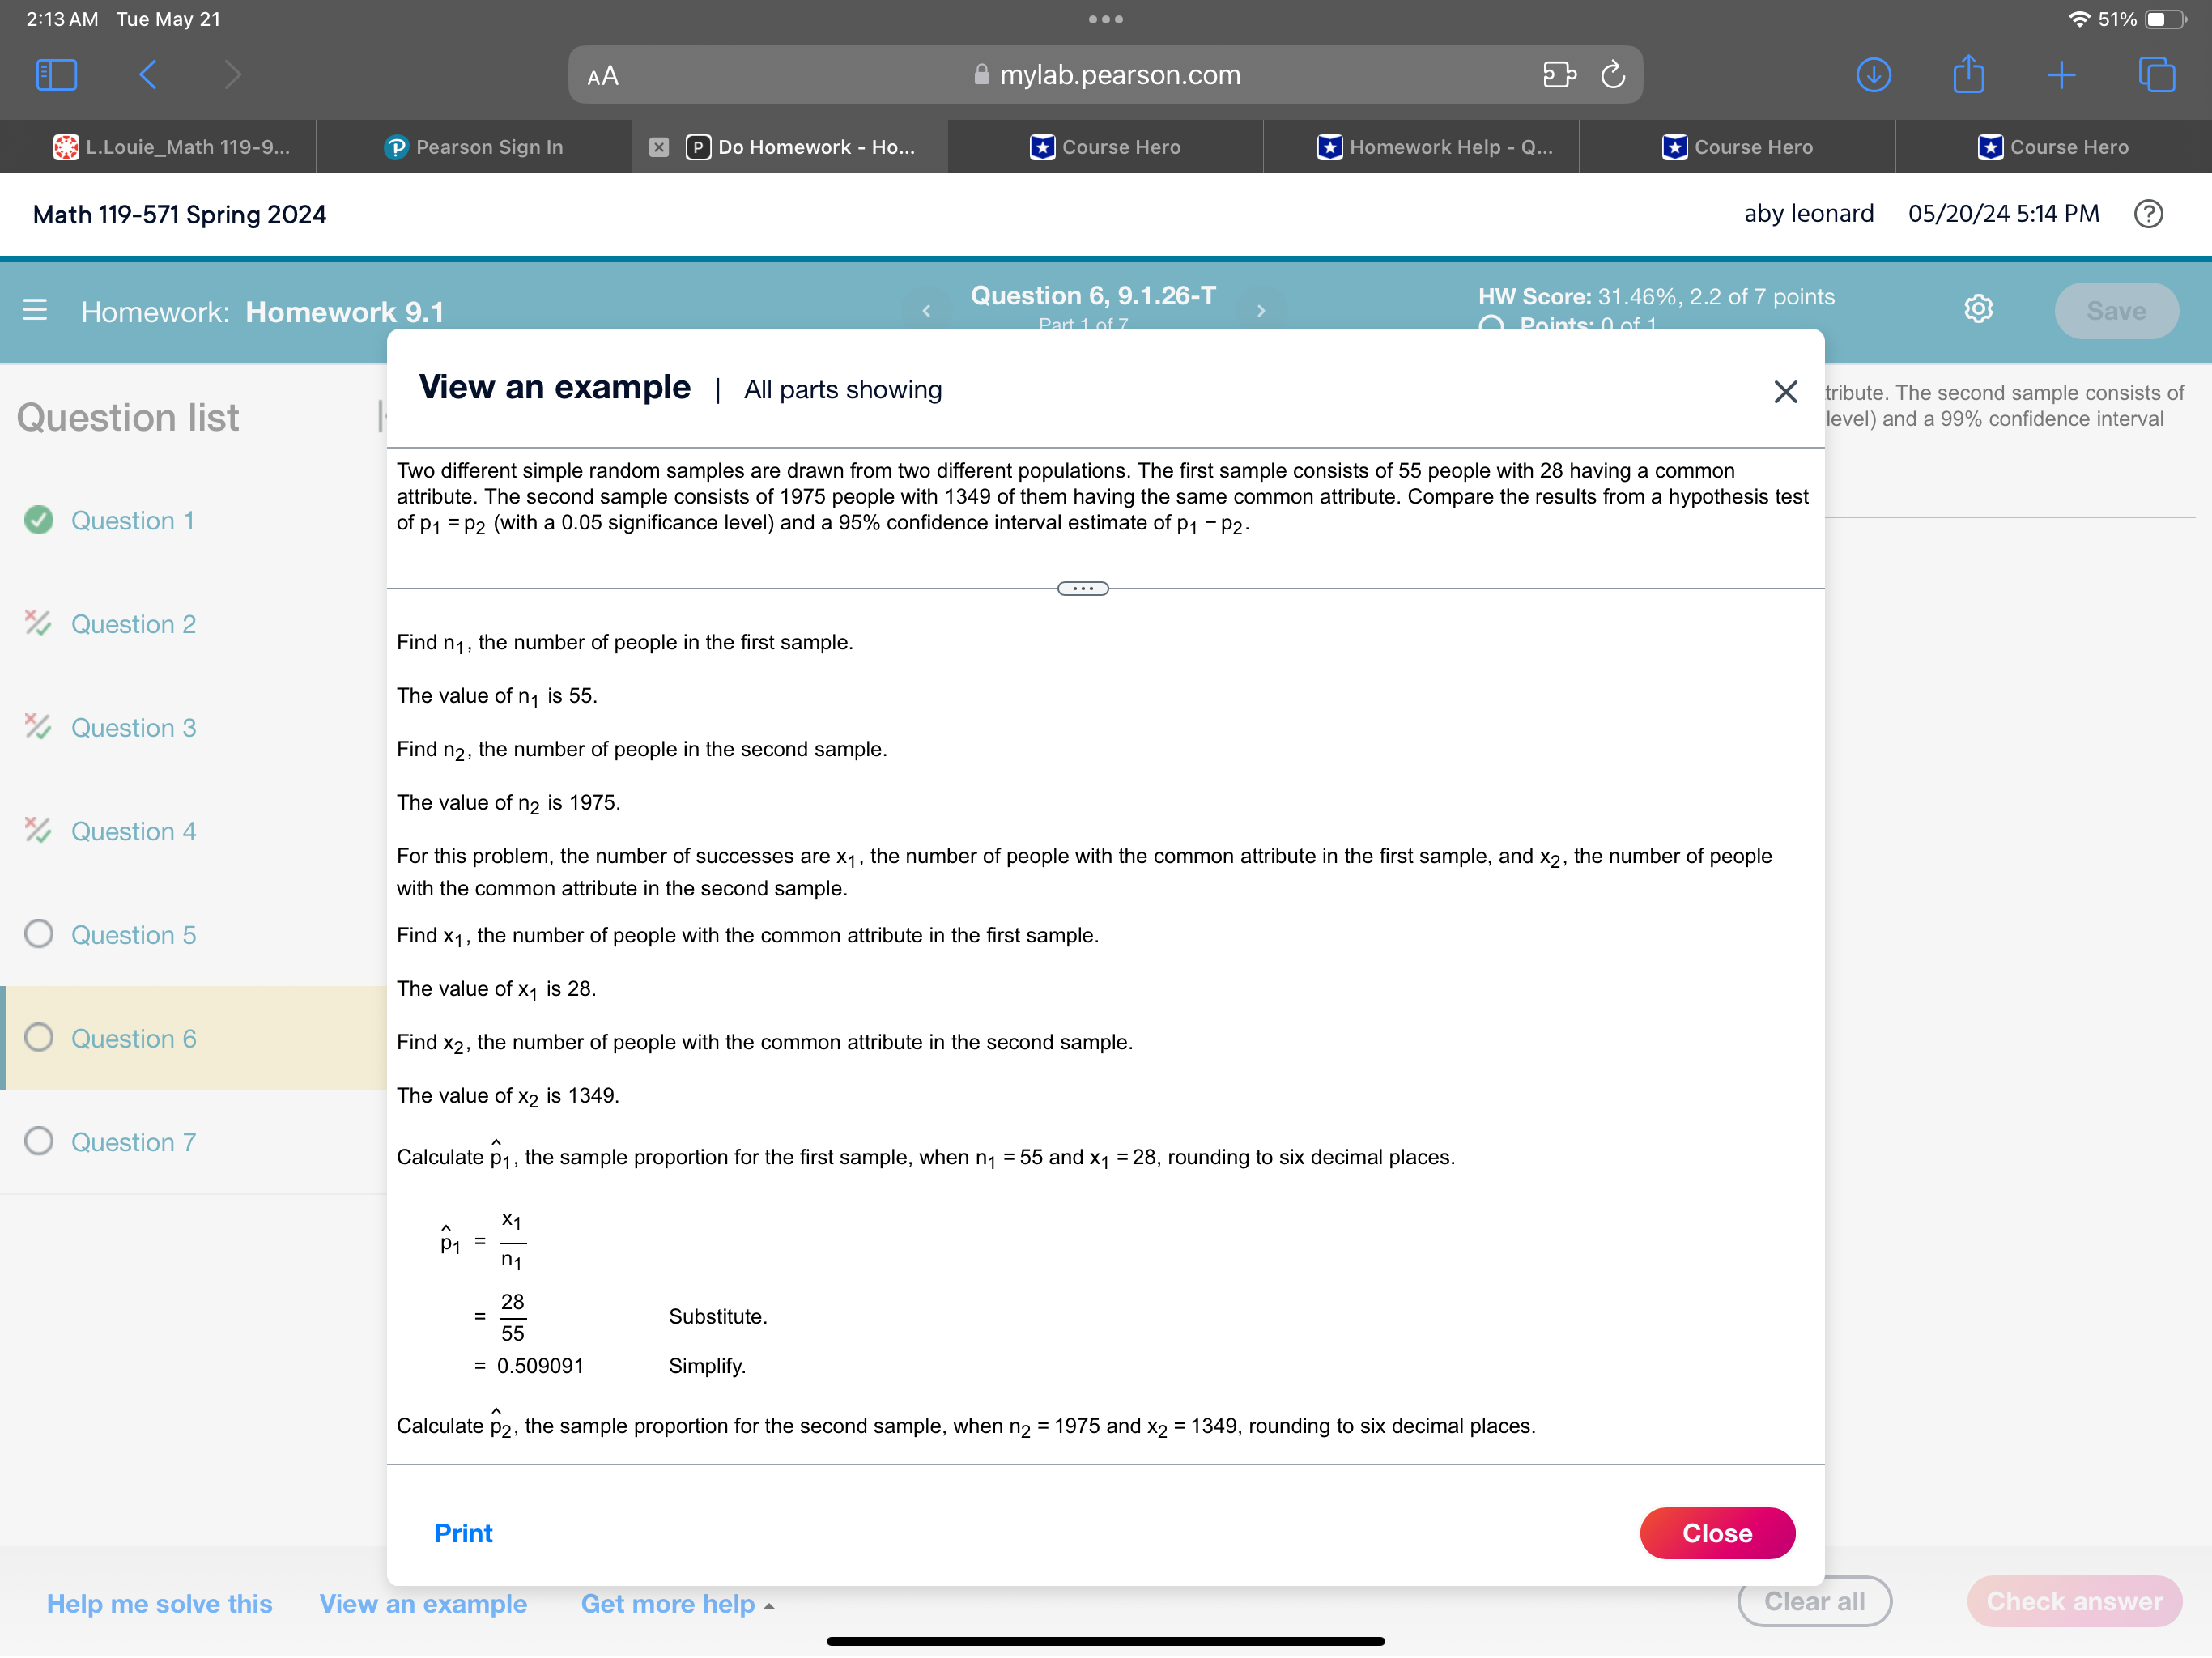
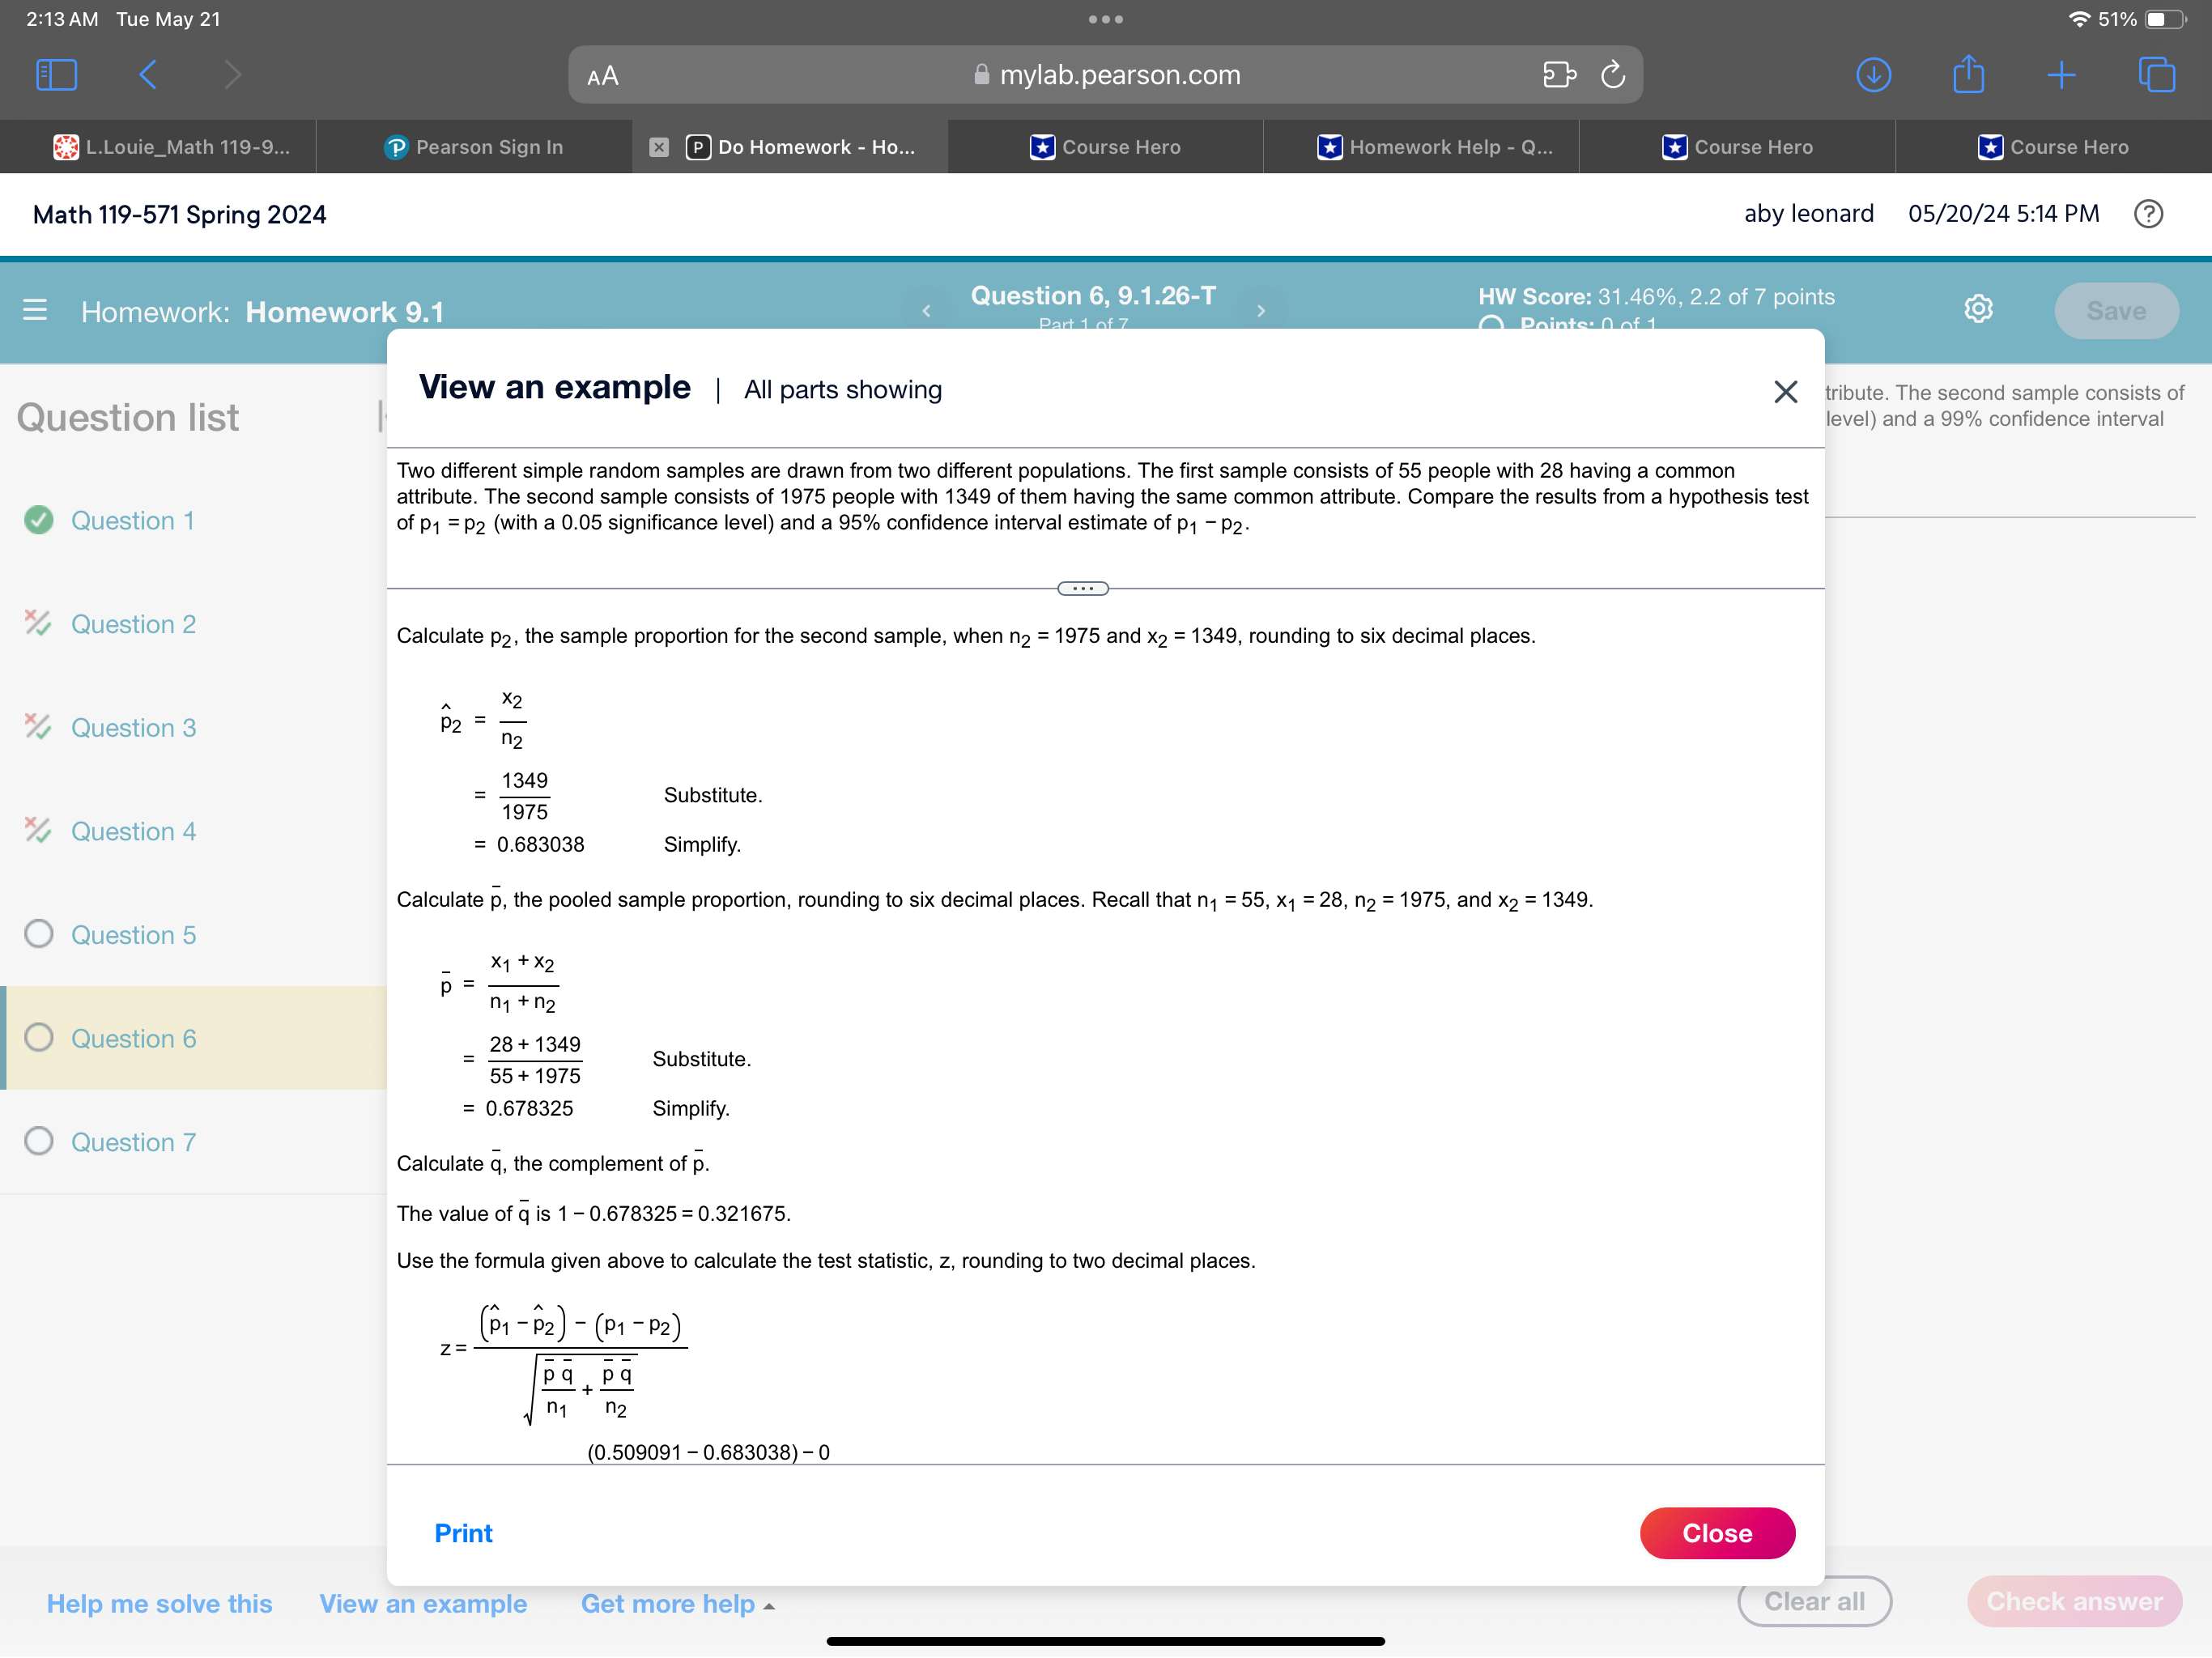
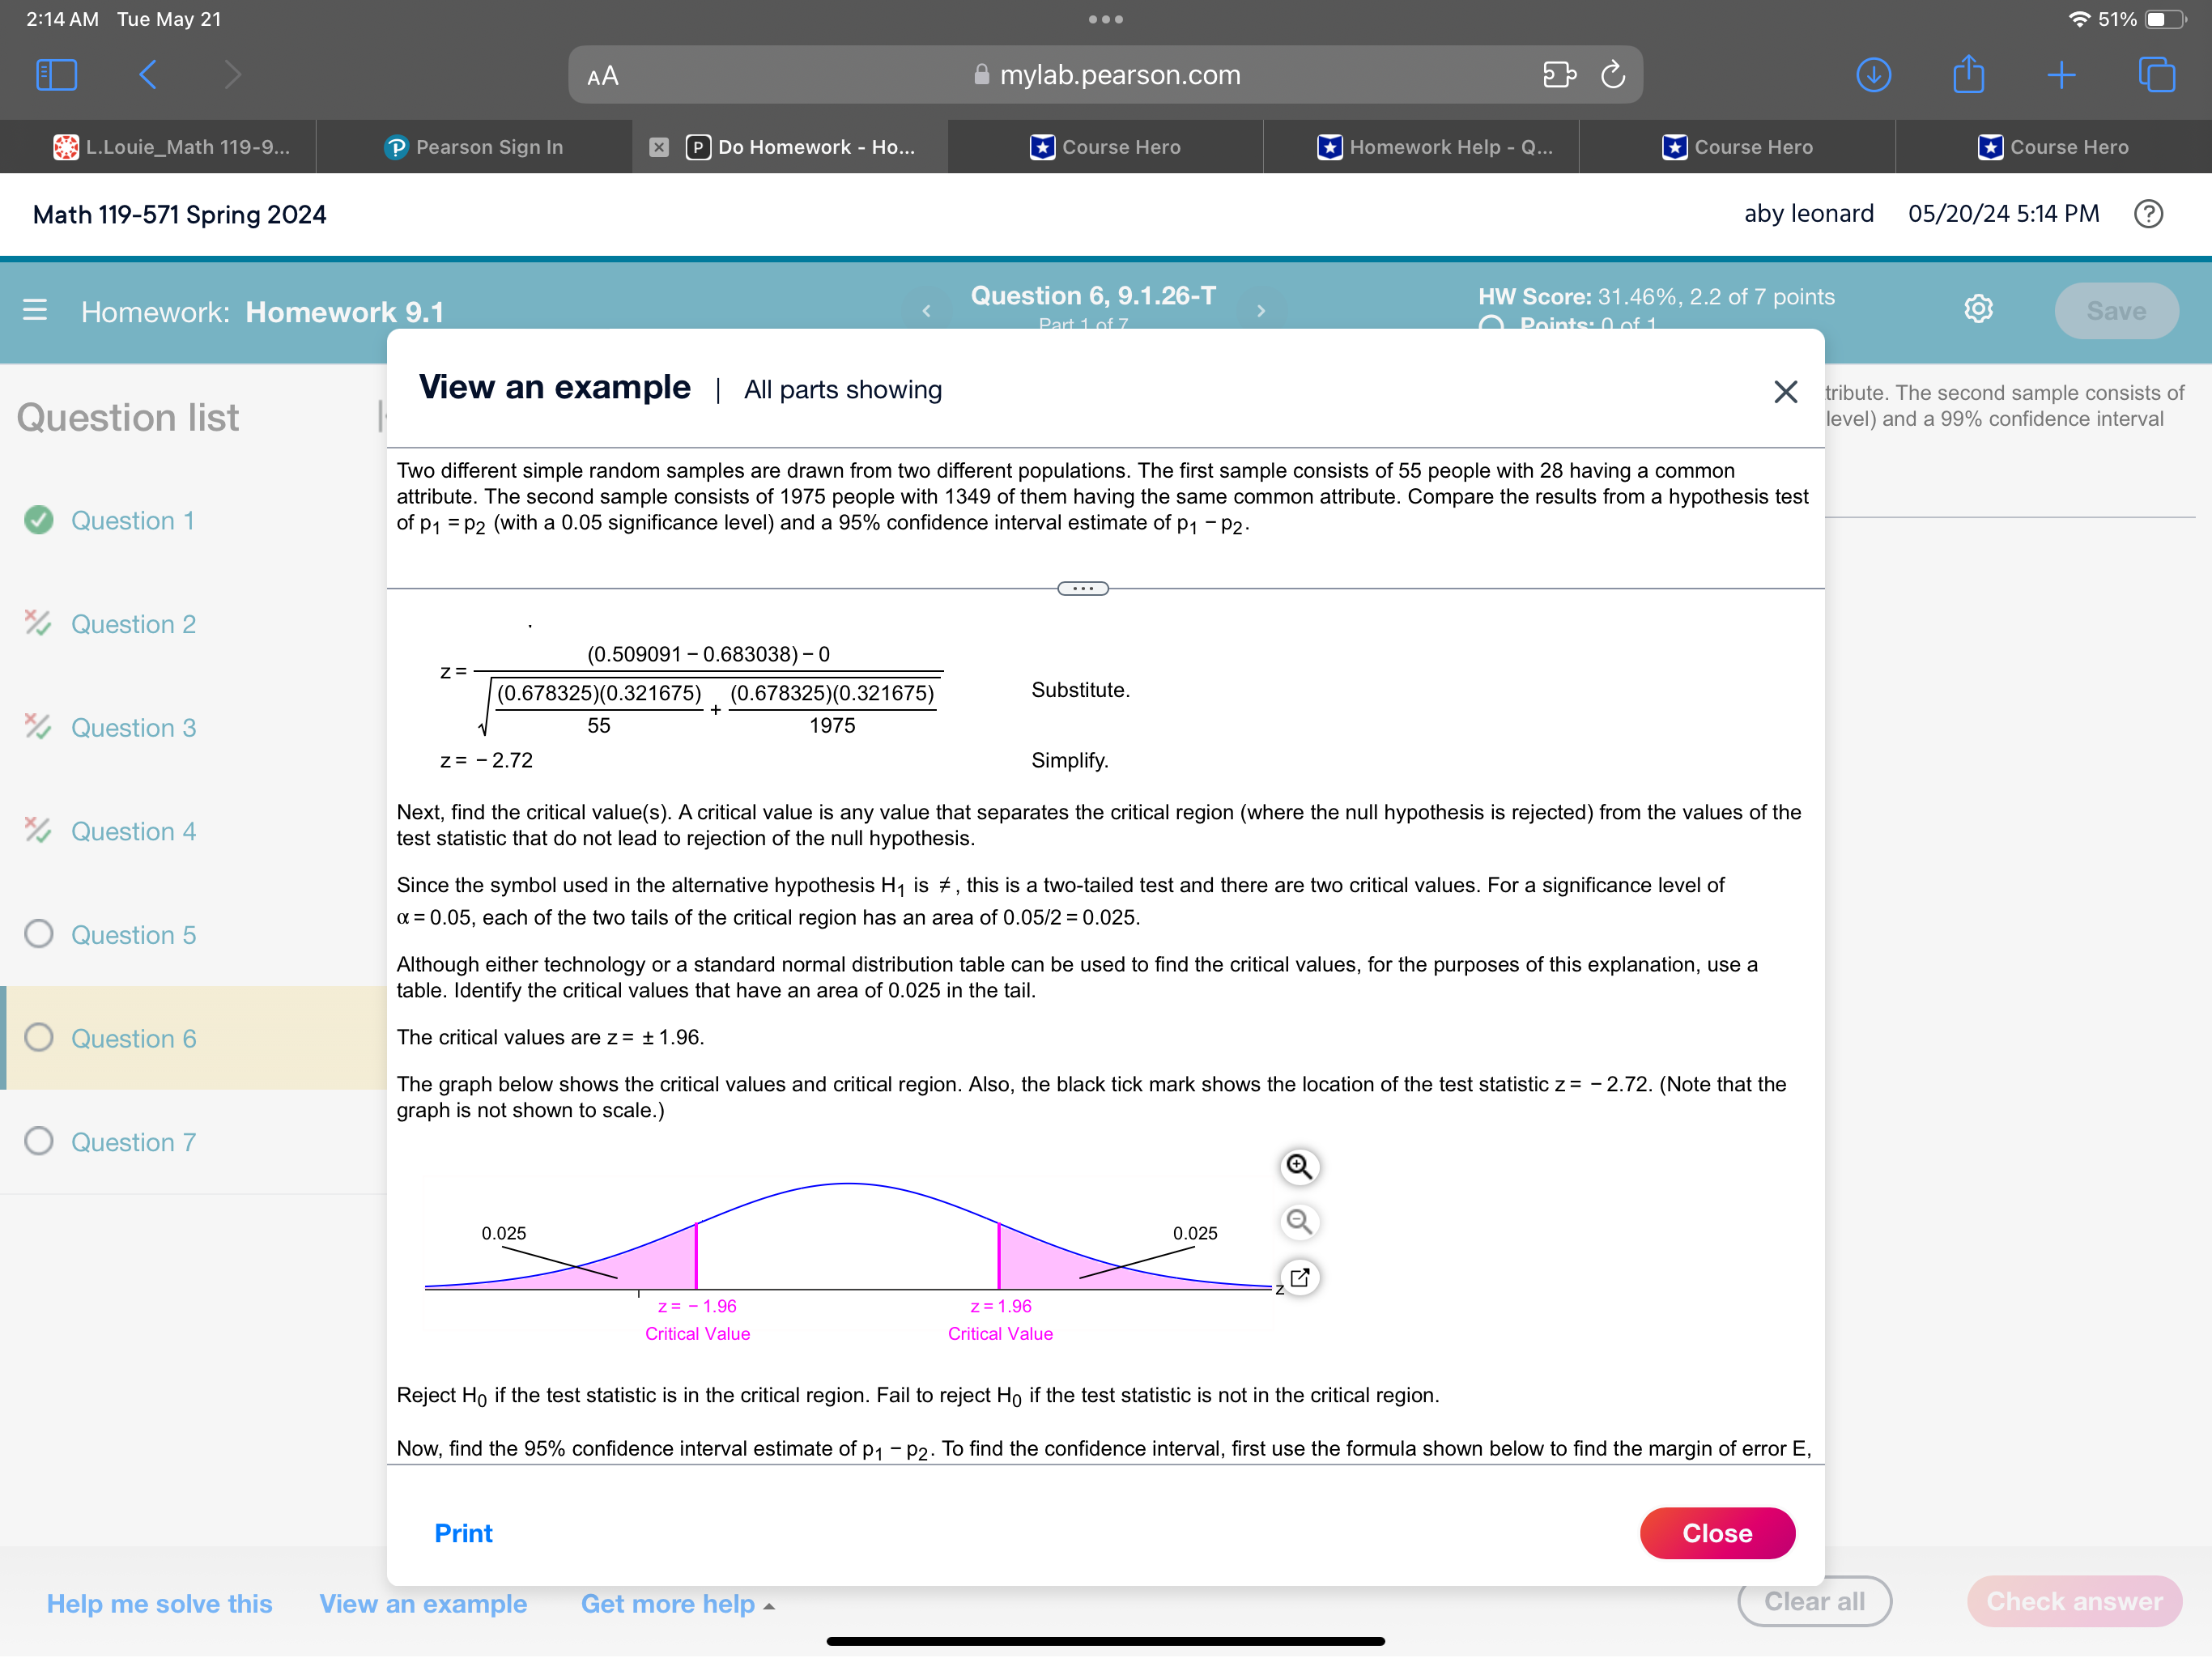
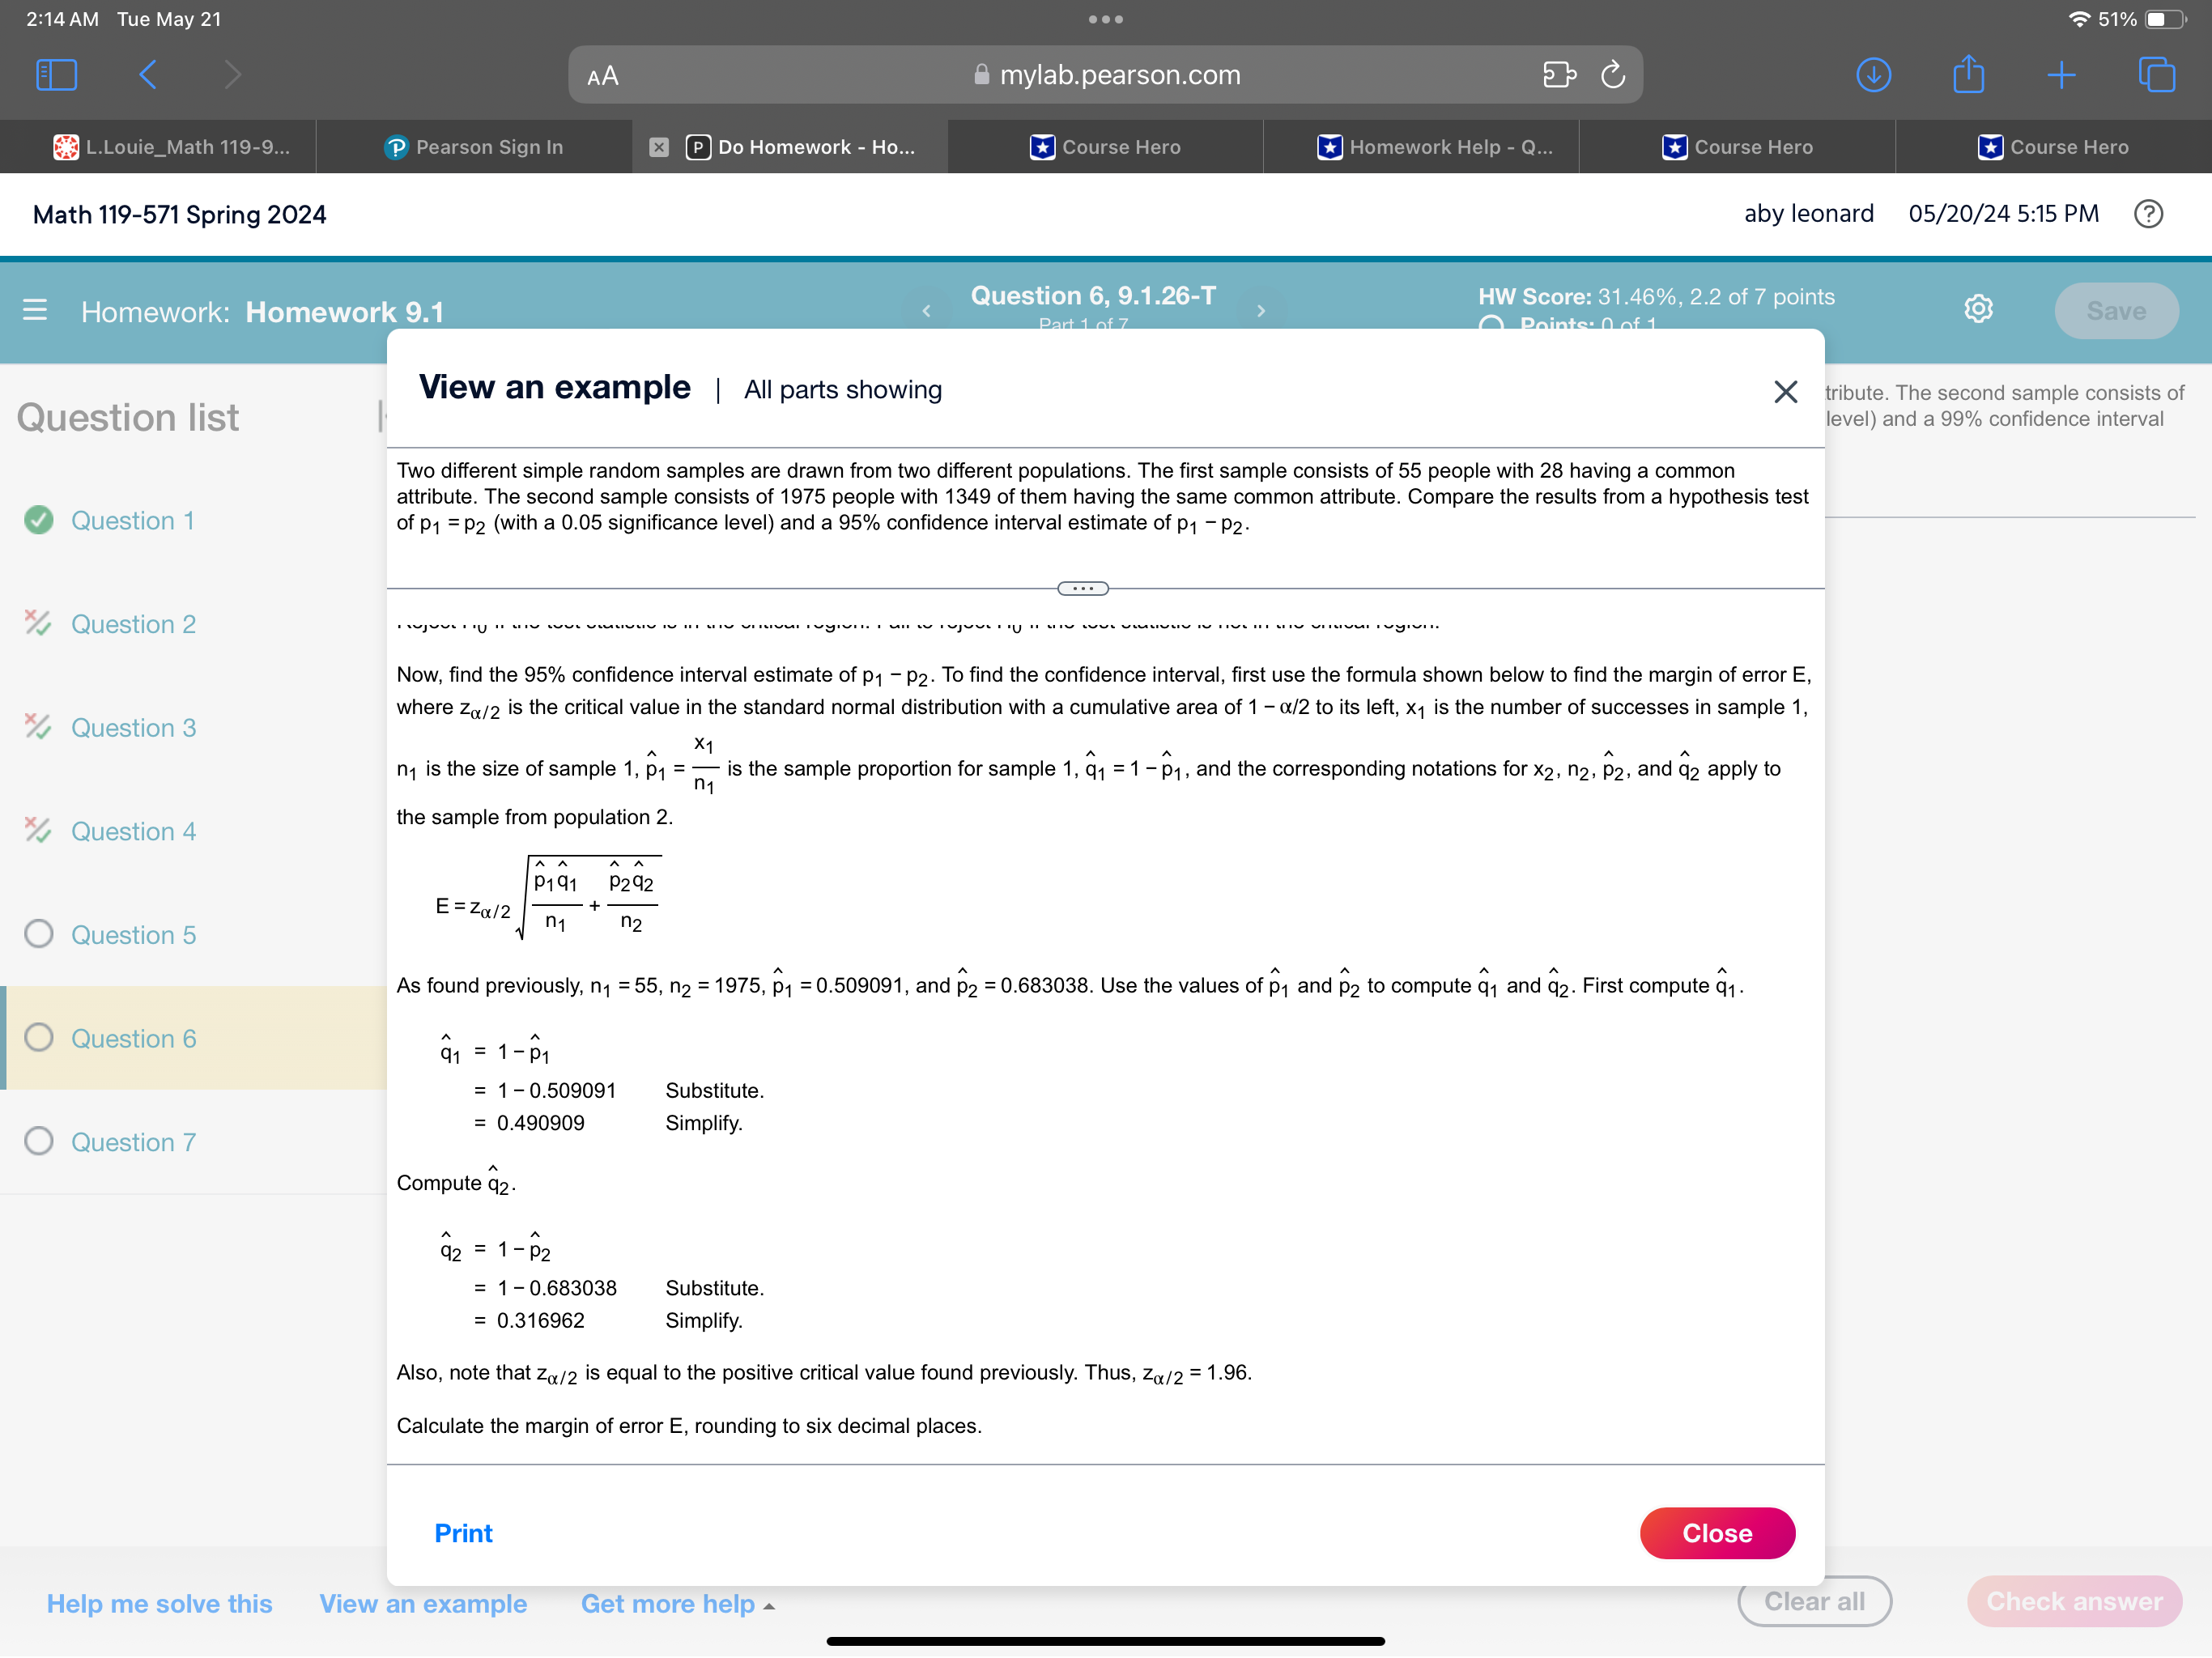
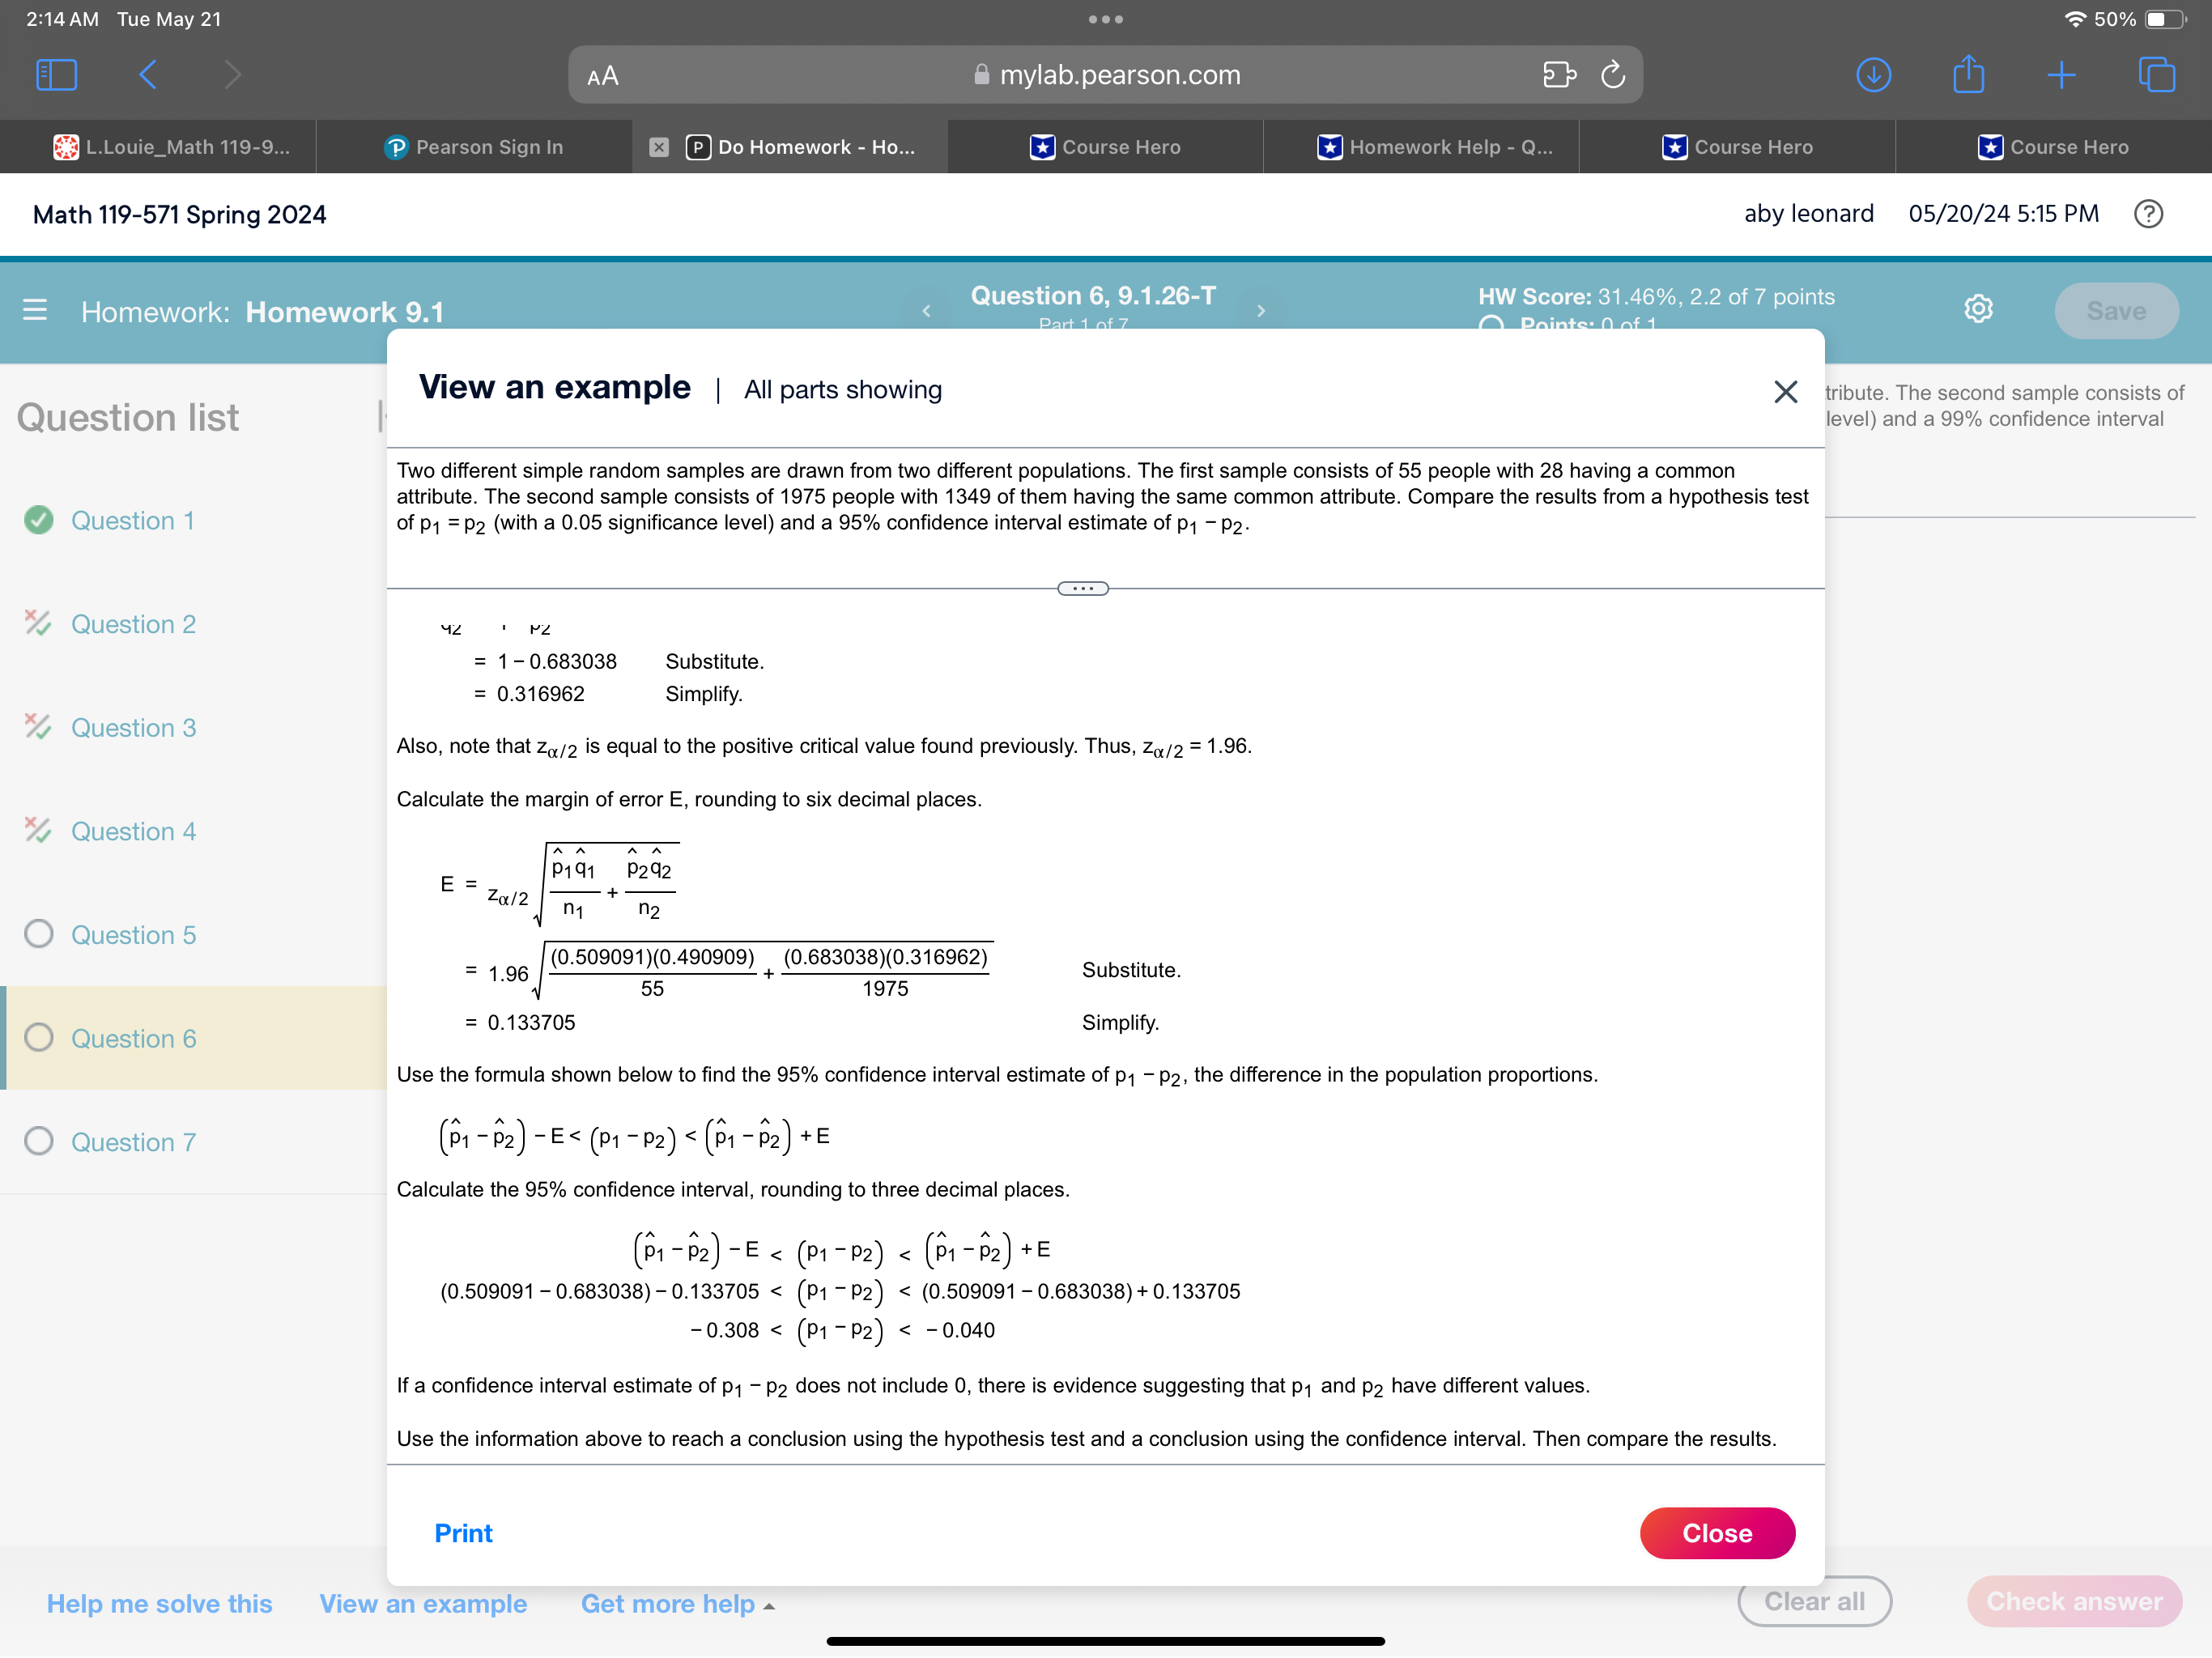
2:09 AM Tue May 21 . . . 52% AA mylab.pearson.com C + L.Louie_Math 119-9... P Pearson Sign In x P Do Homework - Ho... Course Hero Course Hero Course Hero Course Hero Math 119-571 Spring 2024 aby leonard 05/20/24 5:10 PM ? Question 6, 9.1.26-T HW Score: 31.46%, 2.2 of 7 points =Homework: Homework 9.1 Save Part 1 of 7 O Points: 0 of 1 Two different simple random samples are drawn from two different populations. The first sample consists of 20 people with 11 having a common attribute. The second sample consists of Question list K 1900 people with 1365 of them having the same common attribute. Compare the results from a hypothesis test of p1 = p2 (with a 0.01 significance level) and a 99% confidence interval estimate of p1 - P2. Question 1 What are the null and alternative hypotheses for the hypothesis test? Question 2 O A. Ho: P1 SP2 O B. Ho: P1 2 P2 O C. Ho: P1 # P2 H1 : P1 # P2 H1 : P1 # P2 H1: P1 = P2 Question 3 O D. Ho: P1 = P2 O E. Ho: P1 = P2 OF. Ho: P1 = P2 H1 : P1 P2 H1 : P1 # P2 Question 4 O Question 5 O Question 6 O Question 7 Help me solve this View an example Get more help Clear all Check answer2:13 AM Tue May 21 . . . 51%O AA mylab.pearson.com C + L.Louie_Math 119-9... P Pearson Sign In x P Do Homework - Ho... Course Hero Homework Help - Q... Course Hero Course Hero Math 119-571 Spring 2024 aby leonard 05/20/24 5:14 PM ? Homework: Homework 9.1 Question 6, 9.1.26-T HW Score: 31.46%, 2.2 of 7 points Points: 0 of 1 Save View an example | All parts showing X tribute. The second sample consists of Question list level) and a 99% confidence interval Two different simple random samples are drawn from two different populations. The first sample consists of 55 people with 28 having a common attribute. The second sample consists of 1975 people with 1349 of them having the same common attribute. Compare the results from a hypothesis test Question 1 of p1 = P2 (with a 0.05 significance level) and a 95% confidence interval estimate of p1 - P2. Question 2 To identify the null and alternative hypotheses, first identify the specific claim or hypothesis to be tested, and put it in symbolic form. The claim is that p1 = P2 Question 3 Next, give the symbolic form that must be true when the original claim is false. The alternative (in symbolic form) to the original claim is p1 # p2 Question 4 Of the two expressions obtained (p1 = p2 and p1 # p2), let the alternative hypothesis H, be the one not containing equality. Let the null hypothesis Ho be the statement of equality. Based on this, the hypotheses are as shown below. O Question 5 Ho: P1 = P2 H1 : P1 # P2 Now, identify the significance level a. Question 6 As specified in the statement of the problem, the significance level is a = 0.05. Use the formula shown below to find the test statistic, z, where the difference in the population proportions is p1 - P2 = 0 (assumed in the Question 7 X1 X 1 + X2 null hypothesis), x1 is the number of successes in sample 1, n, is the size of sample 1, p1 = is the sample proportion for sample 1, P = - is - n1 + n2 the pooled sample proportion, q = 1 - p, and the corresponding notations for x2, n2, and p2 apply to the sample from population 2. 23 . (P1 -P2) - (P1 -P2) pa pa n2 Find n1, the number of people in the first sample. Print Close Help me solve this View an example Get more help Clear all Check answer2:13 AM Tue May 21 . . . 51%O AA mylab.pearson.com C + L.Louie_Math 119-9... P Pearson Sign In x P Do Homework - Ho... Course Hero Homework Help - Q... Course Hero Course Hero Math 119-571 Spring 2024 aby leonard 05/20/24 5:14 PM ? Homework: Homework 9.1 Question 6, 9.1.26-T HW Score: 31.46%, 2.2 of 7 points Points: 0 of 1 Save View an example | All parts showing X tribute. The second sample consists of Question list level) and a 99% confidence interval Two different simple random samples are drawn from two different populations. The first sample consists of 55 people with 28 having a common attribute. The second sample consists of 1975 people with 1349 of them having the same common attribute. Compare the results from a hypothesis test Question 1 of p1 = P2 (with a 0.05 significance level) and a 95% confidence interval estimate of p1 - P2. Question 2 Find n1, the number of people in the first sample. The value of n1 is 55. Question 3 Find n2, the number of people in the second sample. The value of n2 is 1975. Question 4 For this problem, the number of successes are x1, the number of people with the common attribute in the first sample, and x2, the number of people with the common attribute in the second sample. O Question 5 Find x1, the number of people with the common attribute in the first sample. The value of X1 is 28. Question 6 Find x2, the number of people with the common attribute in the second sample. The value of X2 is 1349. Question 7 Calculate p1, the sample proportion for the first sample, when n1 = 55 and x1 = 28, rounding to six decimal places. X1 p1 = n1 28 = 55 Substitute. = 0.509091 Simplify. Calculate p2, the sample proportion for the second sample, when n2 = 1975 and X2 = 1349, rounding to six decimal places. Print Close Help me solve this View an example Get more help Clear all Check answer2:13 AM Tue May 21 . . . 51%O AA mylab.pearson.com C + L.Louie_Math 119-9... P Pearson Sign In x P Do Homework - Ho... Course Hero Homework Help - Q... Course Hero Course Hero Math 119-571 Spring 2024 aby leonard 05/20/24 5:14 PM ? Homework: Homework 9.1 Question 6, 9.1.26-T HW Score: 31.46%, 2.2 of 7 points Points: 0 of 1 Save View an example | All parts showing X tribute. The second sample consists of Question list level) and a 99% confidence interval Two different simple random samples are drawn from two different populations. The first sample consists of 55 people with 28 having a common attribute. The second sample consists of 1975 people with 1349 of them having the same common attribute. Compare the results from a hypothesis test Question 1 of p1 = P2 (with a 0.05 significance level) and a 95% confidence interval estimate of p1 - P2. Question 2 Calculate p2, the sample proportion for the second sample, when n2 = 1975 and x2 = 1349, rounding to six decimal places. Question 3 p2 = X2 1349 1975 Substitute. Question 4 = 0.683038 Simplify Calculate p, the pooled sample proportion, rounding to six decimal places. Recall that n1 = 55, x1 = 28, n2 = 1975, and x2 = 1349. O Question 5 X1 + X2 p= n1 + n2 Question 6 = . 28 + 1349 Substitute. 55 + 1975 = 0.678325 Simplify. Question 7 Calculate q, the complement of p. The value of q is 1 - 0.678325 = 0.321675. Use the formula given above to calculate the test statistic, z, rounding to two decimal places. (P1 - P2) - (P1 - P2 ) 2= . pa + pq n1 n2 (0.509091 - 0.683038) -0 Print Close Help me solve this View an example Get more help Clear all Check answer2:14 AM Tue May 21 & mylab.pearson.com [E] Do Homework - Ho... Math 119-571 Spring 2024 aby leonard 05/20/245:14PM (2) ] LY = B Y I 1 = Moenee Mermraris] p Quest . LA BN . AR R RS S A eIl @ @ i . View an example | All parts showing X tribute. The second sample consists of Quest|0n list | level) and a 99% confidence interval Two different simple random samples are drawn from two different populations. The first sample consists of 55 people with 28 having a common attribute. The second sample consists of 1975 people with 1349 of them having the same common attribute. Compare the results from a hypothesis test 0 Question 1 of p1 =py (with a 0.05 significance level) and a 95% confidence interval estimate of pq pa. % Question 2 (0.509091 - 0.683038) - 0 (0.678325)(0.321675) z= Substitute. % Question 3 z=-272 Simplify. A Next, find the critical value(s). A critical value is any value that separates the critical region (where the null hypothesis is rejected) from the values of the % Question 4 test statistic that do not lead to rejection of the null hypothesis. Since the symbol used in the alternative hypothesis Hy is #, this is a two-tailed test and there are two critical values. For a significance level of a=0.05, each of the two tails of the critical region has an area of 0.05/2 = 0.025. O Question 5 Although either technology or a standard normal distribution table can be used to find the critical values, for the purposes of this explanation, use a table. Identify the critical values that have an area of 0.025 in the tail. O Question 6 The critical values are z= +1.96. The graph below shows the critical values and critical region. Also, the black tick mark shows the location of the test statistic z= - 2.72. (Note that the graph is not shown to scale.) O Question 7 0.025 0.025 o\\ ). T .U z=-1.96 z=1.96 Critical Value Critical Value Reject Hy if the test statistic is in the critical region. Fail to reject Hy if the test statistic is not in the critical region. Now, find the 95% confidence interval estimate of p4 - p5. To find the confidence interval, first use the formula shown below to find the margin of error E, Help me solve this View an example Get more help ("Cleara 2:14 AM Tue May 21 . . . 51%O AA mylab.pearson.com C + L.Louie_Math 119-9... P Pearson Sign In x P Do Homework - Ho... Course Hero Homework Help - Q... Course Hero Course Hero Math 119-571 Spring 2024 aby leonard 05/20/24 5:15 PM Question 6, 9.1.26-T HW Score: 31.46%, 2.2 of 7 points Homework: Homework 9.1 Points: 0 of 1 Save View an example | All parts showing X tribute. The second sample consists of Question list level) and a 99% confidence interval Two different simple random samples are drawn from two different populations. The first sample consists of 55 people with 28 having a common attribute. The second sample consists of 1975 people with 1349 of them having the same common attribute. Compare the results from a hypothesis test Question 1 of p1 = P2 (with a 0.05 significance level) and a 95% confidence interval estimate of p1 - P2. Question 2 Now, find the 95% confidence interval estimate of p1 - P2. To find the confidence interval, first use the formula shown below to find the margin of error E, where Za/2 is the critical value in the standard normal distribution with a cumulative area of 1 - /2 to its left, x1 is the number of successes in sample 1, Question 3 X1 n1 is the size of sample 1, p1 = is the sample proportion for sample 1, q1 = 1 - p1, and the corresponding notations for x2, n2, P2, and q2 apply to Question 4 the sample from population 2. p191 P292 E= Za/2 O Question 5 n1 n2 As found previously, n1 = 55, n2 = 1975, p1 = 0.509091, and p2 = 0.683038. Use the values of p1 and p2 to compute q, and q2. First compute q1 . Question 6 91 = 1 - p = 1-0.509091 Substitute. = 0.490909 Simplify Question 7 Compute q2 92 = 1 - p2 1-0.683038 Substitute. = 0.316962 Simplify Also, note that Za/2 is equal to the positive critical value found previously. Thus, Zx/2 = 1.96. Calculate the margin of error E, rounding to six decimal places. Print Close Help me solve this View an example Get more help Clear all Check answer2:14 AM Tue May 21 & mylab.pearson.com [ ] [E] Do Homework - Ho... Math 119-571 Spring 2024 = Homework: Homework 9.1 is equal to the positive critical value found previously. Thus, zy/2 = 1.96. Calculate the margin of error E, rounding to six decimal places. %2 Question 4 P292 n2 O Question 5 (0.509091)(0.490909) (0.683038)(0.316962) = Substitute. 196 55 1975 3 = 0.133705 Simplify. O Question 6 plify. Use the formula shown below to find the 95% confidence interval estimate of pq - p, the difference in the population proportions. O Question 7 (91 Pz) \"E
Step by Step Solution
There are 3 Steps involved in it

Get step-by-step solutions from verified subject matter experts


