

Answered step by step
Verified Expert Solution
Question
1 Approved Answer
950 to 1950 1970 to 1979 Average 1980 to 1989 Average 2000 to 2009 Average 2.0 4.6 2.5 1950 to 1959 1960 to 1969 1970
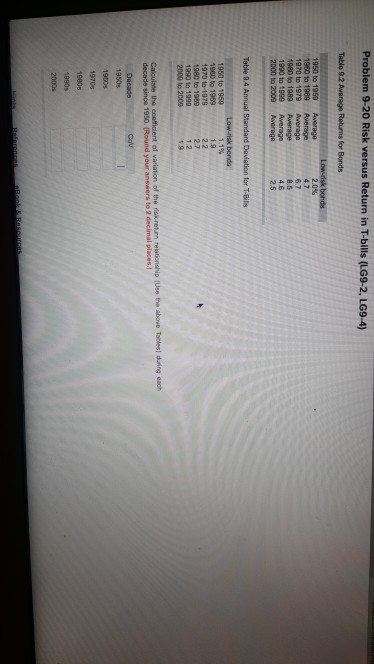
950 to 1950 1970 to 1979 Average 1980 to 1989 Average 2000 to 2009 Average 2.0 4.6 2.5 1950 to 1959 1960 to 1969 1970 to 1979 1980 to 1989 1990 1999 2000 to 2008 2.2 ince 1950. (Round your answers to 2 decimal places.) Decade 1990s
Step by Step Solution
There are 3 Steps involved in it
Step: 1

Get Instant Access to Expert-Tailored Solutions
See step-by-step solutions with expert insights and AI powered tools for academic success
Step: 2

Step: 3
Ace Your Homework with AI
Get the answers you need in no time with our AI-driven, step-by-step assistance
Get Started
Understanding financial statements
Authors: Lyn M. Fraser, Aileen Ormiston
9th Edition
136086241, 978-0136086246