

Answered step by step
Verified Expert Solution
Question
1 Approved Answer
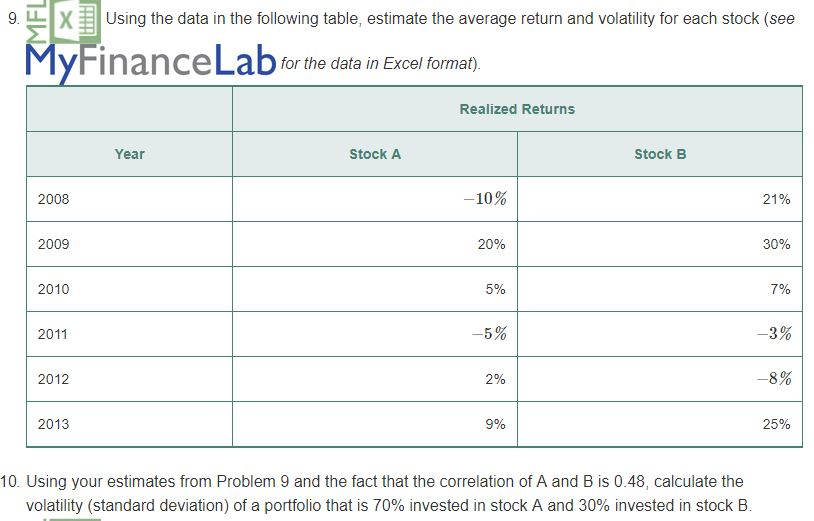
9.LLX Using the data in the following table, estimate the average return and volatility for each stock (see MyFinanceLab for the data in Excel format)
Step by Step Solution
There are 3 Steps involved in it
Step: 1

Get Instant Access to Expert-Tailored Solutions
See step-by-step solutions with expert insights and AI powered tools for academic success
Step: 2

Step: 3
Ace Your Homework with AI
Get the answers you need in no time with our AI-driven, step-by-step assistance
Get Started
Banking Secrecy And Global Finance
Authors: Donato Masciandaro, Olga Balakina
1st Edition
1137400099, 978-1137400093