

Question: A 1 2 2015 2016 2017 2018 2019 405.9 360.7 424.8 514.3 600.6 (188.1) (175.5) (204.8) (251.5) (298.1) 217.8 185.2 220 262.8 302.5 (68.1) (64.8)
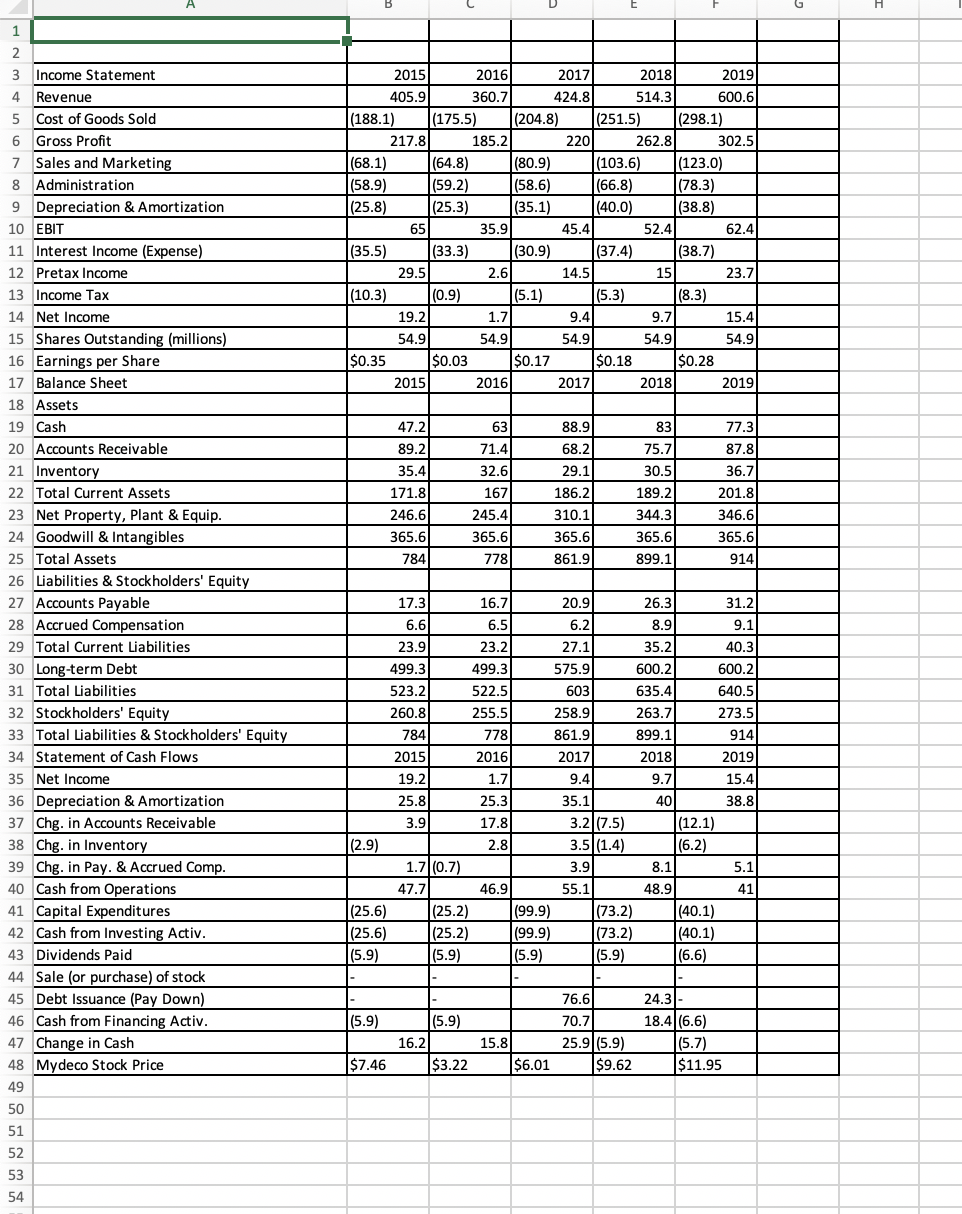
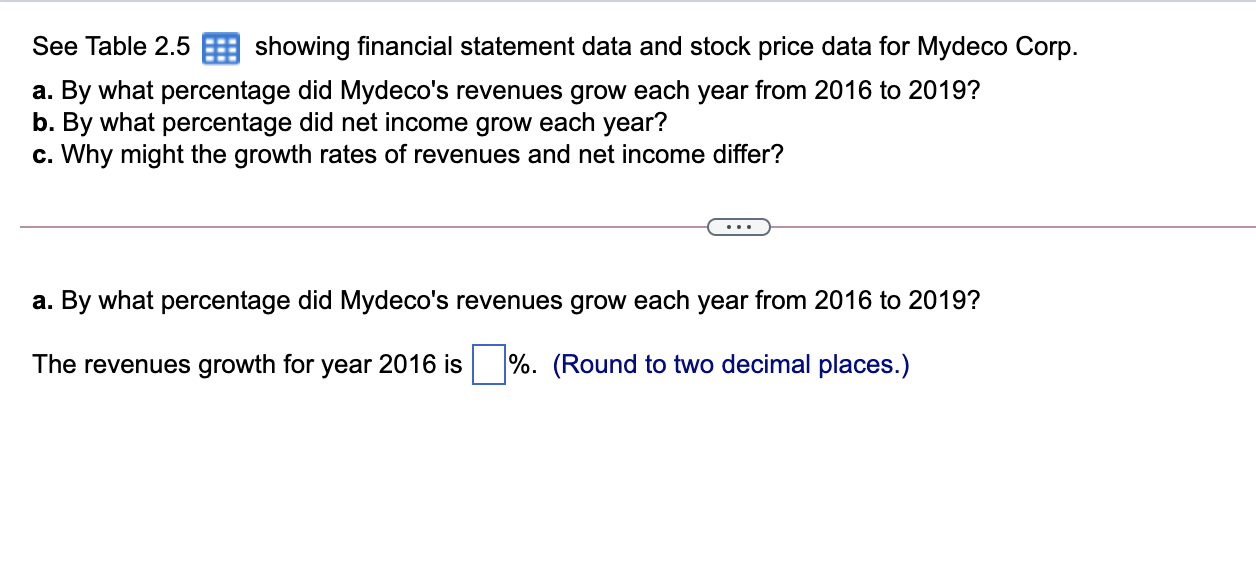
A 1 2 2015 2016 2017 2018 2019 405.9 360.7 424.8 514.3 600.6 (188.1) (175.5) (204.8) (251.5) (298.1) 217.8 185.2 220 262.8 302.5 (68.1) (64.8) (80.9) (103.6) |(123.0) (58.9) (59.2) (58.6) (66.8) (78.3) (25.8) (25.3) (35.1) (40.0) (38.8) 65 35.9 45.4 52.41 62.41 (35.5) (33.3) (30.9) (37.4) (38.7) 29.5 2.6 14.5 15 23.7 (10.3) (0.9) (5.1) (5.3) (8.3) 19.2 1.7 9.4 9.7 15.4 54.9 54.9 54.9 54.9 54.9 $0.35 $0.03 $0.17 $0.18 $0.28 2015 2016 2017 2018 2019 88.9 83 68.2 47.21 89.2 35.4 171.8 246.6 365.6 784 63 71.4 32.6 167 245.4 365.6 29.1 186.21 310.1 75.7 30.5 189.2 344.3 365.6 77.3 87.81 36.7 201.8 346.6 365.61 914 365.6 861.9 778 899.1 3 Income Statement 4 Revenue 5 Cost of Goods Sold 6 Gross Profit 7 Sales and Marketing 8 Administration 9 Depreciation & Amortization 10 EBIT 11 Interest Income (Expense) 12 Pretax Income 13 Income Tax 14 Net Income 15 Shares Outstanding (millions) 16 Earnings per Share 17 Balance Sheet 18 Assets 19 Cash 20 Accounts Receivable 21 Inventory 22 Total Current Assets 23 Net Property, Plant & Equip. 24 Goodwill & Intangibles 25 Total Assets 26 Liabilities & Stockholders' Equity 27 Accounts Payable 28 Accrued Compensation 29 Total Current Liabilities 30 Long-term Debt 31 Total Liabilities 32 Stockholders' Equity 33 Total Liabilities & Stockholders' Equity 34 Statement of Cash Flows 35 Net Income 36 Depreciation & Amortization 37 Chg. in Accounts Receivable 38 Chg. in Inventory 39 Chg. in Pay. & Accrued Comp. 40 Cash from Operations 41 Capital Expenditures 42 Cash from Investing Activ. 43 Dividends Paid 44 Sale (or purchase) of stock 45 Debt Issuance (Pay Down) 46 Cash from Financing Activ. 47 Change in Cash 48 Mydeco Stock Price 49 50 51 52 53 54 17.3 16.7 20.9 26.3 31.2 6.6 6.5 6.2 8.9 9.1 23.9 23.2 27.1 35.2 40.3 499.3 499.3 575.9 600.2 600.2 523.2 522.5 603 635.4 640.5 260.8 255.5 258.9 263.7 273.5 784 778 861.9 899.1 914 2015 2016 2017 2018 2019 19.2 1.7 9.4 9.7 15.4 25.8 25.3 35.1 40 38.8 3.9 17.8 3.2 (7.5) (12.1) (2.9) 2.8 3.5 (1.4) (6.2) 1.7 (0.7) 3.9 8.1 5.1 47.7 46.9 55.1 48.9 41 (25.6) (25.2) (99.9) (73.2) (40.1) (25.6) (25.2) (99.9) (73.2) (40.1) (5.9) (5.9) (5.9) (5.9) (6.6) . - 76.6 24.31- (5.9) (5.9) 70.7 18.4|(6.6) 16.2 15.8 25.9 (5.9) (5.7) $7.46 $3.22 $6.01 $9.62 $11.95 See Table 2.5 showing financial statement data and stock price data for Mydeco Corp. a. By what percentage did Mydeco's revenues grow each year from 2016 to 2019? b. By what percentage did net income grow each year? c. Why might the growth rates of revenues and net income differ? a. By what percentage did Mydeco's revenues grow each year from 2016 to 2019? The revenues growth for year 2016 is %. (Round to two decimal places.)
Step by Step Solution
There are 3 Steps involved in it

Get step-by-step solutions from verified subject matter experts