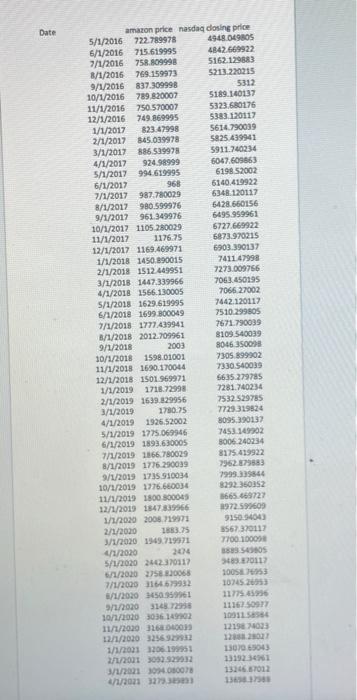
a (1) Find the monthly return of Amazon and Nasdaq (2) Run a liner regression to estimate beta of Amazon. (3) Use Corr (Amazon return, Nasdaq return) X STDEV(Standard deviation of Amazon return)/ STDEV (standard deviation of Nasdaq return) to find beta of Amazon. (4) Use the security market line or capital asset pricing model to find the required rate of return of Amazon, assuming market return is 12% and risk free rate is 3% 2. Assume a stock that has a payout ratio of 30%, a current dividend of $2, a return on investment of 12%, and a beta of 1.45. Its dividends are assumed to grow at a constant rate. Assume market return of 12% and risk-free rate of 3%. (1) Find the growth rate (2) Estimate the expected future dividends for the next 50 years (3) Find the require rate of return. (4) Find the present value of expected future dividends and the sum of all. (5) Use the constant growth rate model Vo=D1/( Kg) to find the value of the stock (6) Compare your answer to (4) and (5). 3. Assume a stock that will pay dividends of $1.55 each year for the next five years and will have an expected price of $25 in five years. It has a beta of 0.86. Market return is 12% and risk-free rate is 3% (1) Find its required rate of return (2) Find its value. (3) if stock price is $18, what is the expected return? Is the price low or high? Is the expected return low or high? Is this stock a good investment? Explain (4) If stock price is $22, what is the expected return? Is the price low or high? Is the expected return low or high? Is this stock a good investment? Explain. Date 2003 amazon price nasdaq dosing price 5/1/2016 722.789978 4948049805 6/1/2016715.619995 4842.669922 7/1/2016 758.809998 5162.129883 8/1/2016 769. 159973 5213.220215 9/1/2016 837.309998 5312 10/1/2016 789.820007 5189.140137 11/1/2016 750 570007 5323.680175 12/1/2016 749.869995 5383.120117 1/1/2017 823.47998 5614790039 2/1/2017 845-039978 5825.439941 3/1/2017 88652997 5911740234 4/1/2017 924.98999 6047.609663 5/1/2017 994.619995 6198 52002 6/1/2017 968 6140.410922 7/1/2017 982.780029 6348120117 8/1/2012 980.599976 5428 660156 9/1/2012 961.349976 5495.999961 10/1/2017 1105 280029 6727.669922 11/1/2017 1176.75 5873.970215 12/1/2017 1169.469971 6903.390137 1/1/2018 1450,890015 7411.47998 2/1/2018 1512.419951 7273.009756 3/1/2018 1447.339966 7063.450195 4/1/2018 1566.130005 7066 27002 5/1/2018 1629.629995 7442.120117 6/1/2018 1699 B00049 7510.299805 7/1/2018 1777439941 7671790039 B/1/2018 2012.709061 8109 540039 9/1/2018 8046 3500 30/1/2018 1598.01001 7305 899902 11/1/2018 16:00 170014 7330 540039 12/1/2018 1501.969971 5635279785 1/1/2019 1718.72998 7281.740234 2/1/2019 1639.829956 7532 529785 3/1/2019 1780.75 7729319924 4/1/2019 1926.52002 8095390132 5/1/2019 1775.069946 7453149702 6/1/2019 1893.630005 B006 240234 7/1/2013 1166.780029 8175.419922 8/1/2015 1776.290039 79627983 9/1/2019 1735.910034 7999335844 10/1/2019 1776660034 829 360352 11/1/2019 1800 300043 1665.669722 12/1/2019 1847339966 1972 590609 1/1/2020 2008.1997 9150 94043 2/1/2020 1883.75 8567.370117 3/1/2020 1949.719571 7700 10001 4/1/2020 2014 88 5S 5/1/2020 2402370117 2011 6/11/2020 275830065 10053 7/1/2000 3164679932 1024526953 //2020 3650959961 11775.45956 91/2020 3145729 11162 509:17 10/1/2020 3036 14102 100115 11/11/2010 326000013 12196 033 12/1/2020325632 12001 1/1/2021 3306 19951 130706904 2/1/20013032929332 1319234 3/1/2013080078 132467012 4/1/2021 327.333 136 a (1) Find the monthly return of Amazon and Nasdaq (2) Run a liner regression to estimate beta of Amazon. (3) Use Corr (Amazon return, Nasdaq return) X STDEV(Standard deviation of Amazon return)/ STDEV (standard deviation of Nasdaq return) to find beta of Amazon. (4) Use the security market line or capital asset pricing model to find the required rate of return of Amazon, assuming market return is 12% and risk free rate is 3% 2. Assume a stock that has a payout ratio of 30%, a current dividend of $2, a return on investment of 12%, and a beta of 1.45. Its dividends are assumed to grow at a constant rate. Assume market return of 12% and risk-free rate of 3%. (1) Find the growth rate (2) Estimate the expected future dividends for the next 50 years (3) Find the require rate of return. (4) Find the present value of expected future dividends and the sum of all. (5) Use the constant growth rate model Vo=D1/( Kg) to find the value of the stock (6) Compare your answer to (4) and (5). 3. Assume a stock that will pay dividends of $1.55 each year for the next five years and will have an expected price of $25 in five years. It has a beta of 0.86. Market return is 12% and risk-free rate is 3% (1) Find its required rate of return (2) Find its value. (3) if stock price is $18, what is the expected return? Is the price low or high? Is the expected return low or high? Is this stock a good investment? Explain (4) If stock price is $22, what is the expected return? Is the price low or high? Is the expected return low or high? Is this stock a good investment? Explain. Date 2003 amazon price nasdaq dosing price 5/1/2016 722.789978 4948049805 6/1/2016715.619995 4842.669922 7/1/2016 758.809998 5162.129883 8/1/2016 769. 159973 5213.220215 9/1/2016 837.309998 5312 10/1/2016 789.820007 5189.140137 11/1/2016 750 570007 5323.680175 12/1/2016 749.869995 5383.120117 1/1/2017 823.47998 5614790039 2/1/2017 845-039978 5825.439941 3/1/2017 88652997 5911740234 4/1/2017 924.98999 6047.609663 5/1/2017 994.619995 6198 52002 6/1/2017 968 6140.410922 7/1/2017 982.780029 6348120117 8/1/2012 980.599976 5428 660156 9/1/2012 961.349976 5495.999961 10/1/2017 1105 280029 6727.669922 11/1/2017 1176.75 5873.970215 12/1/2017 1169.469971 6903.390137 1/1/2018 1450,890015 7411.47998 2/1/2018 1512.419951 7273.009756 3/1/2018 1447.339966 7063.450195 4/1/2018 1566.130005 7066 27002 5/1/2018 1629.629995 7442.120117 6/1/2018 1699 B00049 7510.299805 7/1/2018 1777439941 7671790039 B/1/2018 2012.709061 8109 540039 9/1/2018 8046 3500 30/1/2018 1598.01001 7305 899902 11/1/2018 16:00 170014 7330 540039 12/1/2018 1501.969971 5635279785 1/1/2019 1718.72998 7281.740234 2/1/2019 1639.829956 7532 529785 3/1/2019 1780.75 7729319924 4/1/2019 1926.52002 8095390132 5/1/2019 1775.069946 7453149702 6/1/2019 1893.630005 B006 240234 7/1/2013 1166.780029 8175.419922 8/1/2015 1776.290039 79627983 9/1/2019 1735.910034 7999335844 10/1/2019 1776660034 829 360352 11/1/2019 1800 300043 1665.669722 12/1/2019 1847339966 1972 590609 1/1/2020 2008.1997 9150 94043 2/1/2020 1883.75 8567.370117 3/1/2020 1949.719571 7700 10001 4/1/2020 2014 88 5S 5/1/2020 2402370117 2011 6/11/2020 275830065 10053 7/1/2000 3164679932 1024526953 //2020 3650959961 11775.45956 91/2020 3145729 11162 509:17 10/1/2020 3036 14102 100115 11/11/2010 326000013 12196 033 12/1/2020325632 12001 1/1/2021 3306 19951 130706904 2/1/20013032929332 1319234 3/1/2013080078 132467012 4/1/2021 327.333 136