Answered step by step
Verified Expert Solution
Link Copied!

Question

1 Approved Answer

(a) [2 points] 0n the graph below (identical to the graph in Q1), illustrate which students the charter will admit. Cost Per Student o 20
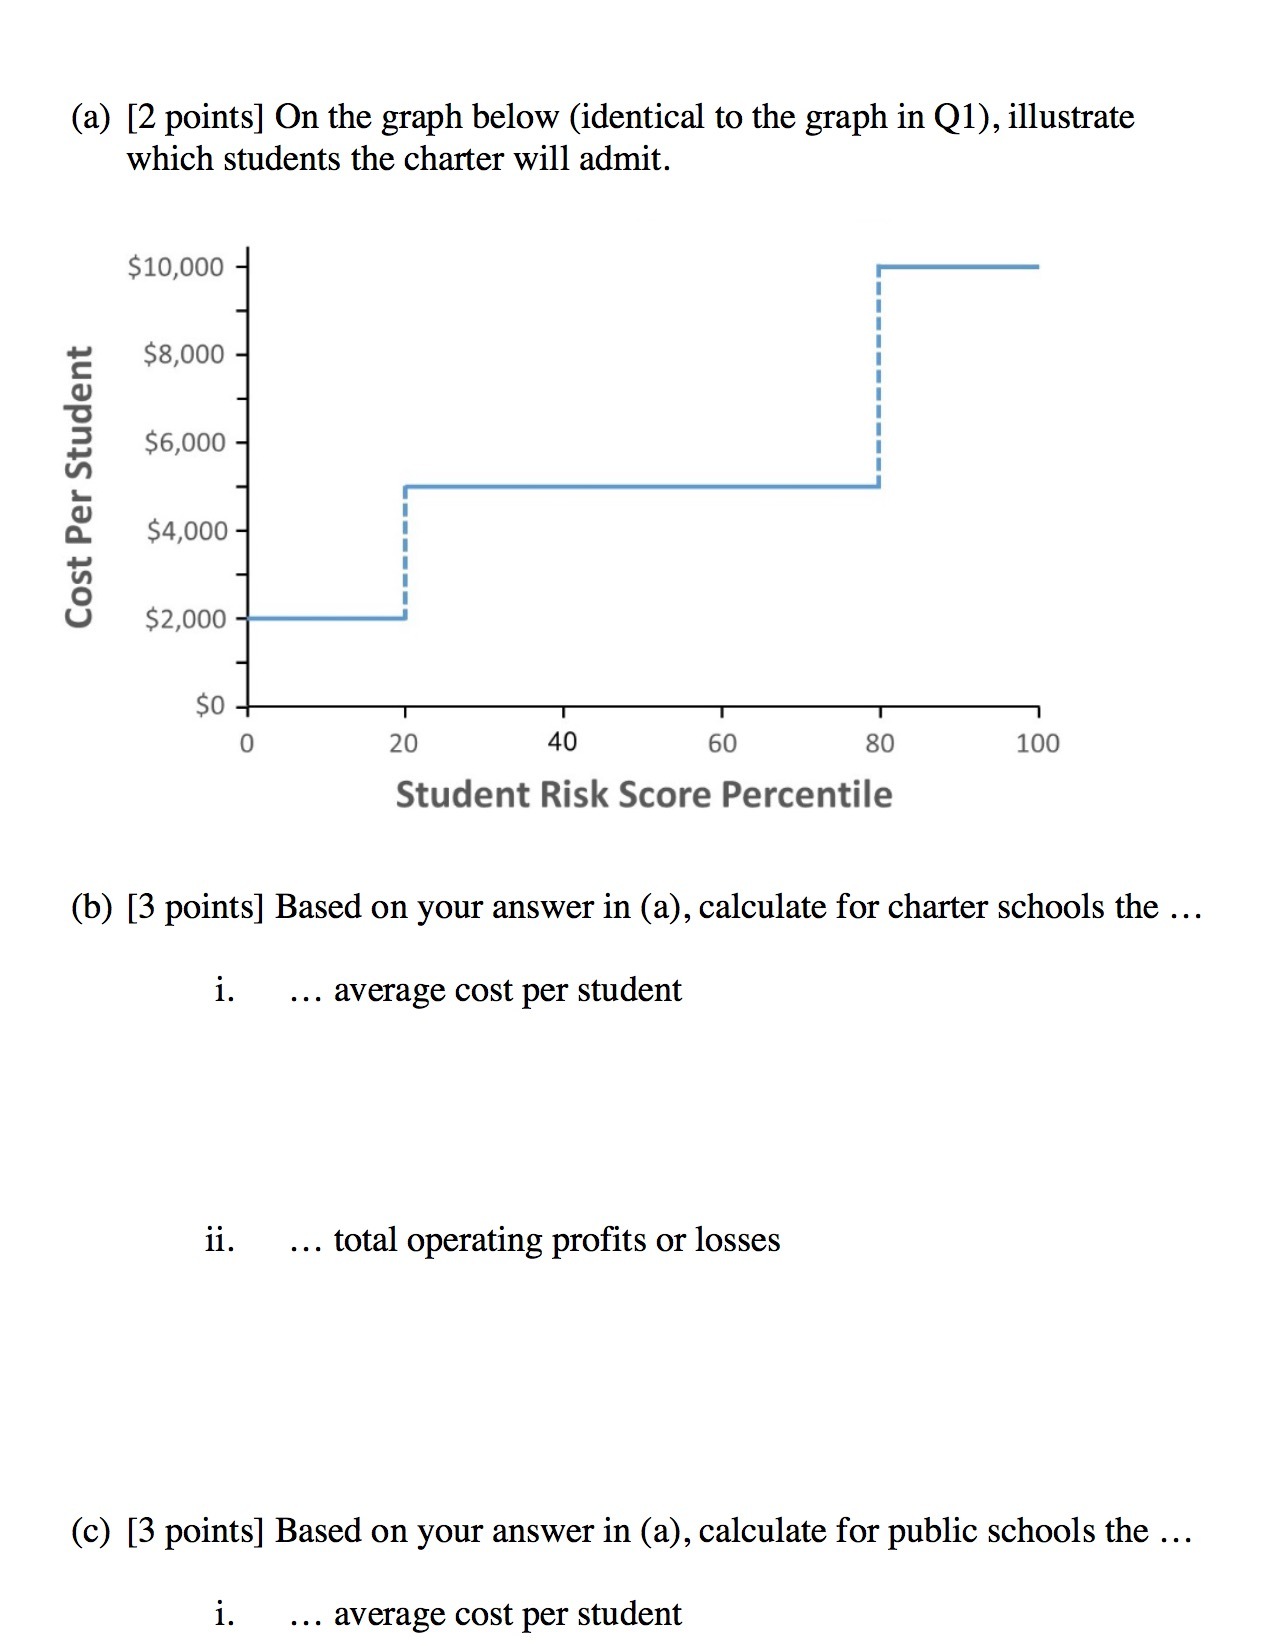
image text in transcribed
(a) [2 points] 0n the graph below (identical to the graph in Q1), illustrate which students the charter will admit. Cost Per Student o 20 40 so so 100 Student Risk Score Percentile (b) [3 points] Based on your answer in (a), calculate for charter schools the i. average cost per student ii. total operating profits or losses (c) [3 points] Based on your answer in (a), calculate for public schools the i. average cost per student

Step by Step Solution

There are 3 Steps involved in it

Step: 1

blur-text-image

Get Instant Access to Expert-Tailored Solutions

See step-by-step solutions with expert insights and AI powered tools for academic success

Step: 2

blur-text-image

Step: 3

blur-text-image

Ace Your Homework with AI

Get the answers you need in no time with our AI-driven, step-by-step assistance

Get Started

Recommended Textbook for

Economics of Money, Banking and Financial Markets

Authors: Frederic S. Mishkin

9th Edition

978-0321607751, 9780321599797, 321607759, 0321599799, 978-0321598905

More Books

Students also viewed these Economics questions

Question

=+How is the amount of reserves banks hold

Answered: 1 week ago