Answered step by step
Verified Expert Solution
Question
1 Approved Answer
A 20160101 41.81 41.81 41.81 41.81 0 A 20160104 41.06 41.19 40.34 40.69 3287300 A 20160105 40.73 40.95 40.34 40.55 2587200 A 20160106 40.24 40.99

| A | 20160101 | 41.81 | 41.81 | 41.81 | 41.81 | 0 |
| A | 20160104 | 41.06 | 41.19 | 40.34 | 40.69 | 3287300 |
| A | 20160105 | 40.73 | 40.95 | 40.34 | 40.55 | 2587200 |
| A | 20160106 | 40.24 | 40.99 | 40.05 | 40.73 | 2103600 |
| A | 20160107 | 40.14 | 40.15 | 38.81 | 39 | 3504300 |
| A | 20160108 | 39.22 | 39.71 | 38.47 | 38.59 | 3736700 |
| A | 20160111 | 38.71 | 38.9 | 37.41 | 37.94 | 2818600 |
| A | 20160112 | 38.43 | 38.58 | 37.65 | 38.19 | 1989300 |
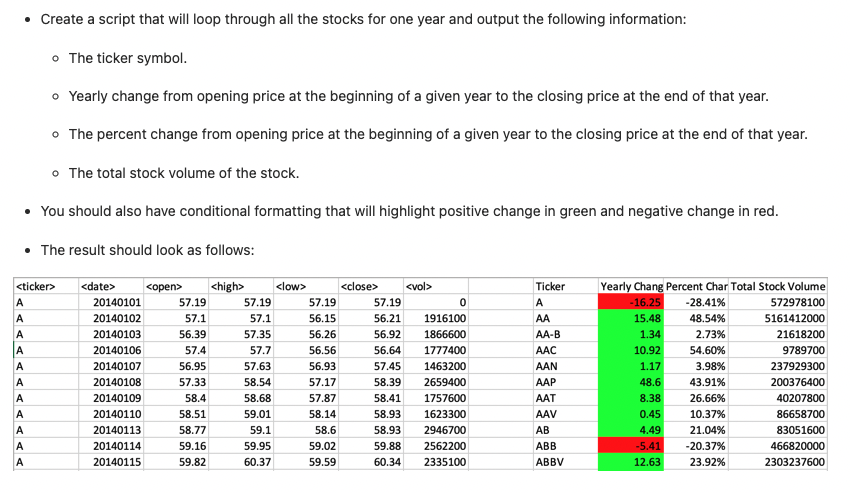
Please write a script that completes the 4 steps above (the answer should produce a chart similar to the one shown above)
Language: Visual Basic (excel)
Create a script that will loop through all the stocks for one year and output the following information: o The ticker symbol. Yearly change from opening price at the beginning of a given year to the closing price at the end of that year. o The percent change from opening price at the beginning of a given year to the closing price at the end of that year. The total stock volume of the stock. You should also have conditional formatting that will highlight positive change in green and negative change in red. The result should look as follows:Step by Step Solution
There are 3 Steps involved in it
Step: 1

Get Instant Access to Expert-Tailored Solutions
See step-by-step solutions with expert insights and AI powered tools for academic success
Step: 2

Step: 3

Ace Your Homework with AI
Get the answers you need in no time with our AI-driven, step-by-step assistance
Get Started


