

Answered step by step
Verified Expert Solution
Question
1 Approved Answer
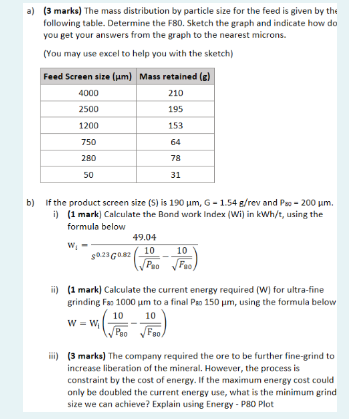
a) (3 marks) The mass distribution by particle size for the feed is given by the following table. Determine the F80. Sketch the graph and
Step by Step Solution
There are 3 Steps involved in it
Step: 1

Get Instant Access to Expert-Tailored Solutions
See step-by-step solutions with expert insights and AI powered tools for academic success
Step: 2

Step: 3
Ace Your Homework with AI
Get the answers you need in no time with our AI-driven, step-by-step assistance
Get Started
Process Control A Practical Approach
Authors: Myke King
2nd Edition
1119157749, 978-1119157748