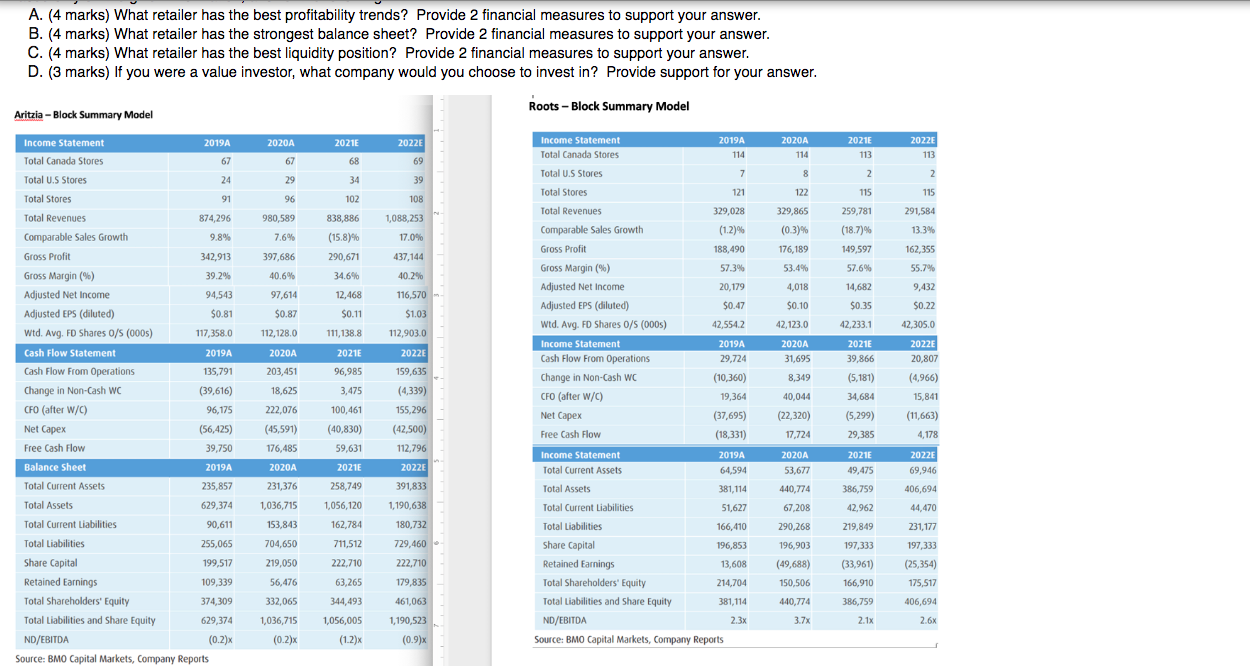
A. (4 marks) What retailer has the best profitability trends? Provide 2 financial measures to support your answer. B. (4 marks) What retailer has the strongest balance sheet? Provide 2 financial measures to support your answer. C. (4 marks) What retailer has the best liquidity position? Provide 2 financial measures to support your answer. D. (3 marks) If you were a value investor, what company would you choose to invest in? Provide support for your answer. Roots -Block Summary Model Aritzia - Block Summary Model 2019A 2020A 2021 2022 2020A 2021E 113 2022E 113 114 67 67 68 69 8 2 24 29 34 39 2 2 115 122 91 96 102 108 115 259,781 291,584 874,296 838,886 1,088,253 980,589 7.6% 329,865 (0.3% (18.7) 13.3% 9.8% (15.8% 17.0% 149,597 342,913 397,686 290,671 437,144 176,189 53.4% 57.6% 162,355 55.7% 9,432 39.2% 40.2% 40.6% 97,614 4,018 14,682 94,543 $0.81 34.6% 12,468 $0.11 Income Statement Total Canada Stores Total U.S Stores Total Stores Total Revenues Comparable Sales Growth Gross Profit Gross Margin (%) Adjusted Net Income Adjusted EPS (diluted) Wtd. Avg. FD Shares 0/S (000s) Cash Flow Statement Cash Flow From Operations Change in Non-Cash WC CFO (after W/C) Net Capex Free Cash Flow Balance Sheet Total Current Assets 116,570 $1.03 $0.10 $0.35 $0.22 $0.87 42, 123.0 42,233.1 42,305.0 117,358.0 112,128.0 111,138.8 112,903.0 2022 2019A 135,791 (39,616) 2020A 203,451 18,625 2021E 96,985 2020A 31,695 8,349 2021E 39,866 (5.181) 2022E 20,807 (4,966) 159,635 3,475 Income Statement 2019A Total Canada Stores 114 Total U.S Stores 7 Total Stores 121 Total Revenues 329,028 Comparable Sales Growth (1.2) Gross Profit 188,490 Gross Margin (%) 57.3% Adjusted Net Income 20,179 Adjusted EPS (diluted) $0.47 Wtd. Avg. FD Shares 0/5 (000s) 42,554.2 Income Statement 2019A Cash Flow From Operations 29,724 Change in Non-Cash wc (10,360) CFO (after W/C) 19,364 Net Capex (37,695) Free Cash Flow (18,331) Income Statement 2019A Total Current Assets 64,594 Total Assets 381,114 Total Current Liabilities 51,627 Total Liabilities 166,410 Share Capital 196,853 Retained Earnings 13,608 Total Shareholders' Equity 214,704 Total Liabilities and Share Equity 381,114 ND/EBITDA 2.3x Source: BMO Capital Markets, Company Reports 40,044 34,684 15,841 222,076 96,175 (56,425) 100,461 (40,830) (4,339) 155,296 (42,500) 112,796 2022E (45,591) (22,320) 17,724 (5,299) 29,385 (11,663) 4,178 176,485 59,631 2020A 53,677 2021E 49,475 2022 69,946 2021E 39,750 2019A 235,857 629,374 2020A 231,376 1,036,715 440,774 258,749 1,056,120 391,833 1,190,638 386,759 42,962 406,694 44,470 Total Assets 67,208 153,843 290,268 231,177 162,784 711,512 180,732 729,460 - 219,849 197,333 704,650 196,903 222,710 (49,688) 219,050 56,476 222,710 179,835 (33,961) 166,910 Total Current Liabilities 90,611 Total Liabilities 255,065 Share Capital 199,517 Retained Earnings 109,339 Total Shareholders' Equity 374,309 Total Liabilities and Share Equity 629,374 ND/EBITDA (0.2)x Source: BMO Capital Markets, Company Reports 197,333 (25,354) 175,517 406,694 63,265 150,506 440,774 332,065 344,493 461,063 386,759 3.7% 2.1x 2.6% 1,036,715 (0.2)x 1,056,005 (1.2) 1,190,523 (0.9)x