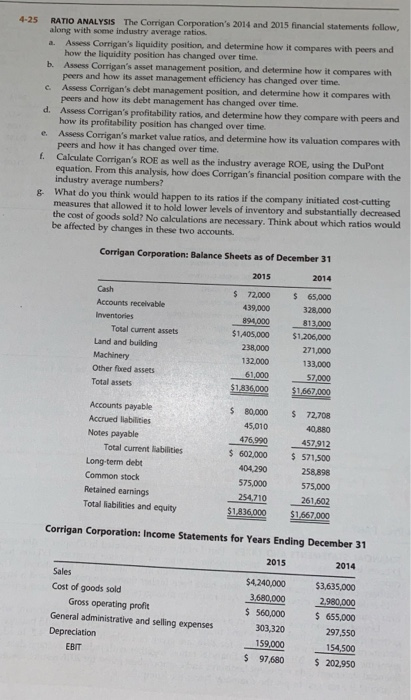
a. 4-25 RATIO ANALYSIS The Corrigan Corporation's 2014 and 2015 financial statements follow, along with some industry average ratios. Assess Corrigan's liquidity position, and determine how it compares with peers and how the liquidity position has changed over time. b. Assess Corrigan's asset management position, and determine how it compares with peers and how its asset management efficiency has changed over time. c Assess Corrigan's debt management position, and determine how it compares with peers and how its debt management has changed over time. d. Assess Corrigan's profitability ratios, and determine how they compare with peers and how its profitability position has changed over time. Assess Corrigan's market value ratios, and determine how its valuation compares with peers and how it has changed over time. 1. Calculate Corrigan's ROE as well as the industry average ROE, using the DuPont equation. From this analysis, how does Corrigan's financial position compare with the industry average numbers? & What do you think would happen to its ratios if the company initiated cost-cutting measures that allowed it to hold lower levels of inventory and substantially decreased the cost of goods sold? No calculations are necessary. Think about which ratios would be affected by changes in these two accounts. Corrigan Corporation: Balance Sheets as of December 31 2015 2014 Cash Accounts receivable Inventories Total current assets Land and building Machinery Other foxed assets Total assets $ 72.000 439,000 894,000 $1,405,000 238,000 132.000 61.000 $1836,000 $ 65,000 328,000 813,000 $1.206,000 271.000 133,000 57.000 $1,667,000 Accounts payable Accrued liabilities Notes payable Total current liabilities Long-term debt Common stock Retained earnings Total abilities and equity $ 80.000 45,010 476,990 $ 602,000 404,290 575,000 254.710 $1,836,000 $ 72,708 40,880 457.912 $ 571,500 258,898 575.000 261602 $1,667,000 Corrigan Corporation: Income Statements for Years Ending December 31 2015 2014 Sales Cost of goods sold Gross operating profit General administrative and selling expenses Depreciation EBIT $4.240,000 3,680.000 $ 560,000 303,320 159.000 $ 97,680 $3,635,000 2.980.000 $ 655,000 297,550 154,500 $ 202,950 a. 4-25 RATIO ANALYSIS The Corrigan Corporation's 2014 and 2015 financial statements follow, along with some industry average ratios. Assess Corrigan's liquidity position, and determine how it compares with peers and how the liquidity position has changed over time. b. Assess Corrigan's asset management position, and determine how it compares with peers and how its asset management efficiency has changed over time. c Assess Corrigan's debt management position, and determine how it compares with peers and how its debt management has changed over time. d. Assess Corrigan's profitability ratios, and determine how they compare with peers and how its profitability position has changed over time. Assess Corrigan's market value ratios, and determine how its valuation compares with peers and how it has changed over time. 1. Calculate Corrigan's ROE as well as the industry average ROE, using the DuPont equation. From this analysis, how does Corrigan's financial position compare with the industry average numbers? & What do you think would happen to its ratios if the company initiated cost-cutting measures that allowed it to hold lower levels of inventory and substantially decreased the cost of goods sold? No calculations are necessary. Think about which ratios would be affected by changes in these two accounts. Corrigan Corporation: Balance Sheets as of December 31 2015 2014 Cash Accounts receivable Inventories Total current assets Land and building Machinery Other foxed assets Total assets $ 72.000 439,000 894,000 $1,405,000 238,000 132.000 61.000 $1836,000 $ 65,000 328,000 813,000 $1.206,000 271.000 133,000 57.000 $1,667,000 Accounts payable Accrued liabilities Notes payable Total current liabilities Long-term debt Common stock Retained earnings Total abilities and equity $ 80.000 45,010 476,990 $ 602,000 404,290 575,000 254.710 $1,836,000 $ 72,708 40,880 457.912 $ 571,500 258,898 575.000 261602 $1,667,000 Corrigan Corporation: Income Statements for Years Ending December 31 2015 2014 Sales Cost of goods sold Gross operating profit General administrative and selling expenses Depreciation EBIT $4.240,000 3,680.000 $ 560,000 303,320 159.000 $ 97,680 $3,635,000 2.980.000 $ 655,000 297,550 154,500 $ 202,950