

Answered step by step
Verified Expert Solution
Question
1 Approved Answer
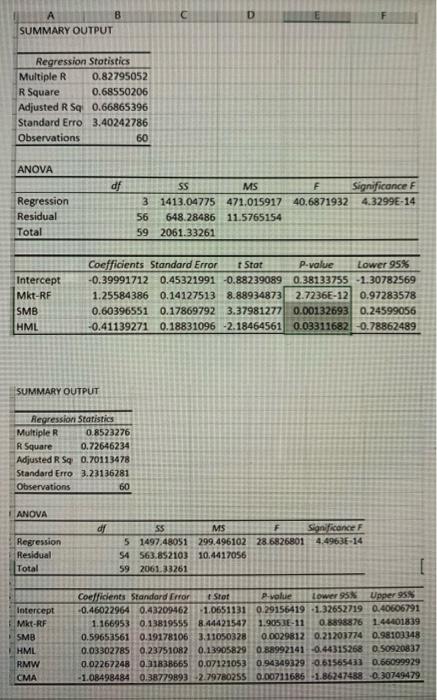
A 8 SUMMARY OUTPUT Regression Statistics Multiple R 0.82795052 R Square 0.68550206 Adjusted R S 0.66865396 Standard Erro 3.40242786 Observations 60 ANOVA df Regression Residual
Step by Step Solution
There are 3 Steps involved in it
Step: 1

Get Instant Access to Expert-Tailored Solutions
See step-by-step solutions with expert insights and AI powered tools for academic success
Step: 2

Step: 3
Ace Your Homework with AI
Get the answers you need in no time with our AI-driven, step-by-step assistance
Get Started
Understanding financial statements
Authors: Lyn M. Fraser, Aileen Ormiston
9th Edition
136086241, 978-0136086246